Chicken wings have become a staple food of Super Bowl parties in the U.S., and demand for them on menus is now at an all-time high leading up to the second biggest eating day of the year – Super Bowl Sunday.
Super Bowl weekend is unquestionably the biggest time of the year for wings. According to the National Chicken Council's
2013 Wing Report, more than 1.23 billion wing portions will be consumed during Super Bowl weekend in 2013, as fans watch the San Francisco 49ers and the Baltimore Ravens battle for the Lombardi Trophy.
To put that into perspective, if 1.23 billion wing segments were laid end to end, they would stretch from Candlestick Park in San Francisco to M&T Bank Stadium in Baltimore… 27 times.
Super Bowl wing consumption is down about one percent, or 12.3 million wings, compared to last year's numbers, but not because demand for them is declining. Quite the opposite, explains Bill Roenigk , chief economist and market analyst at the Washington, D.C.-based National Chicken Council.
"Chicken companies produced about one percent fewer birds last year, due in large part to record high corn and feed prices," Roenigk said. "Corn makes up more than two-thirds of chicken feed and corn prices hit an all-time high in 2012, due to two reasons: last summer's drought and pressure from a federal government requirement that mandates 40 percent of our corn crop be turned into fuel in the form of ethanol. Simply put, less corn equals higher feed costs, which means fewer birds produced."
Ranch Hands Bleu Cheese Decisive Defeat in New Poll
Almost six in 10 (57 percent) U.S. adults who eat chicken wings said they typically like to eat their wings with ranch dressing, according to a new National Chicken Council poll conducted by Harris Interactive*. Only about three in 10 (35 percent) prefer bleu cheese dressing.
Adults who eat chicken wings who live in the Northeast, though, are significantly more likely to prefer bleu cheese dressing (47 percent Northeast vs. 32 percent Midwest, 30 percent South and 32 percent West), while those in other parts of the country are more likely to prefer ranch dressing (65 percent Midwest, 56 percent South and 64 percent West vs. 44 percent Northeast).
The data also show that nearly four in five U.S. adults (79 percent) eat chicken wings and that consumption does not vary significantly by region or gender. Women (77 percent) are just as likely as men (82 percent) to roll up their sleeves, break out the wet naps and eat a few wings.
"The data show that chicken wings are not bound by gender or geographic lines," added the council's Roenigk. "We also know that they are nonpartisan and politically independent. That is, there are really no extreme left wings or extreme right wings."
Perhaps not surprisingly, among adults who eat wings, women are more likely than men to say they like to eat their wings with celery (39 percent women vs. 28 percent men).
After ranch dressing at the top: 43 percent of wing lovers chose barbecue sauce as their typical snack or dipping sauce; 38 percent said hot sauce; 35 percent said bleu cheese; and 34 percent chose celery. Fewer than one in five wing lovers (8 percent) described themselves as purists who eat nothing with their wings.
Wing-onomics
The vast majority of wings, especially those destined for restaurants, are disjointed, with the third joint (the thin part known as the flapper) being exported to Asian countries and the meatier first and second joints being sold domestically. The wing is usually split into two parts – or portions or segments – known as the "drumette" and the mid-section or "flat" and sold to restaurants or retail grocery outlets.
A chicken has two wings, and chicken companies are not able to produce wings without the rest of the chicken. Therefore, the supply of wings is limited by the total number of chickens produced. When the demand for wings is stronger than the demand for other chicken parts, the price of wings will go up, as it has this past year.
The wholesale price of wings will be the most expensive ever during Super Bowl XLVII as demand rises and the supply has shrunk. Wings are also currently the highest priced part of the chicken.
Wholesale wings are currently at about $2.11 a pound (Northeast), the highest on record at the U.S. Department of Agriculture, up 22 cents or 12 percent from a year earlier.
Wing prices always go up in the fourth quarter of the year as restaurants stock up for the Super Bowl and prices usually peak in January during the run-up to the big game. But many analysts expect that demand will hold steady even after the NFL season ends.
"Demand for wings is proving more and more to be inelastic," Roenigk added. "With the rising number of restaurants with menus dedicated to wings, the return of the NHL hockey season, the NCAA March Madness basketball tournament and then the start of grilling season, wing demand should remain hot."
But Roenigk adds that consumers shouldn't worry about any shortage of wings on Super Bowl Sunday or any time soon.
"The good news for consumers is that restaurants plan well in advance to ensure they have plenty of wings for the big game," he said. "And some restaurants are promoting boneless wings and some are offering flexible serving sizes. But if you're planning to cook your own wings, I wouldn't advise being in line at the supermarket two hours before kickoff."
Retail Grocery and Supermarkets
According to Nielsen Perishables Group FreshFacts® data, both fresh and prepared wings totaled $1.6 billion in sales for the 52 weeks ending November 24, 2012, an increase of 5.4 percent compared to a year earlier.
Wing sales at grocery stores and supermarkets spike dramatically the week of the Super Bowl, but the data show that consumers also stock up the week before, too.
Consumers cooking their own wings at home can find traditional and unique chicken wing recipes on the National Chicken Council website at
www.eatchicken.com. With Super Bowl XLVII being played in New Orleans, Cajun-style wings might be in order.
Food Service/Restaurants
Originally on and off various fast-food menus, chicken wings have become a staple of casual dining and pizza places. Virtually every casual dining chain offers chicken wings as an appetizer, if not also as an entrée.
Increasingly, ready-to-eat or heat-and-eat wings are showing up in the delicatessen and prepared foods section of supermarkets, a growing trend.
"Orders at carry-outs and restaurants for chicken wings on Super Bowl Sunday will increase more on that day than any other winter Sunday - a 156 percent increase," said Harry Balzer , vice president of the NPD Group, a market research firm.
Chicken is a very popular dish overall on that day… and it's not just wings. According to NPD Group data, chicken strips will also be up 43 percent over a typical winter Sunday and orders for fried chicken on the bone will be up 33 percent.
Wing-specific Restaurants are Hot on Super Bowl Weekend
Wingstop, a Texas-based restaurant franchise with 550 locations, is prepping for the biggest day of the year when they expect to sauce and toss more than six million wings at restaurants across the country. Wingstop expects Super Sunday business to be up 15 percent over last year, and if Wingstop reaches its goal this will be the 13th straight year the company has set a big game sales record.
"The Super Bowl is the second biggest eating holiday of the year, after Thanksgiving. With the growing demand for wings, we are gearing up for this to be our biggest year yet," said Charlie Morrison , Wingstop president and CEO.
The Rest of the Year – 2013
Although America's taste for chicken wings is no hotter than during Super Bowl weekend, the National Chicken Council estimates that overall in 2013 more than 13.25 billion chicken wings, about three billion pounds, will be marketed as wings (as opposed to the wings on a whole chicken, for example). The actual number of wing portions sold is estimated to be 26.5 billion because, as noted above, the vast majority of wings are cut into two segments or portions. This is about a two-percent decrease from 2012, reflecting chicken production estimates for 2013.
History of the Chicken Wing
Deep-fried chicken wings have long been a staple of Southern cooking. But the concept of cooking wings in peppery hot sauce was born in 1964 at the Anchor Bar in Buffalo, New York, when co-owner Teressa Bellissimo cooked leftover wings in hot sauce as a late-night snack for her son and his friends. The boys liked them so much that the Bellissimos put them on the menu the next day. Served with celery slices and bleu cheese sauce, "Buffalo Wings" were an instant hit.
Dick Winger , who sold hot sauce to the bar, went on the road with Dominic Bellissimo , the owners' son, to promote the item and sell hot sauce, and the item gradually caught on with restaurant operators around the country. The concept hit the big time in 1990, when McDonald's began selling Mighty Wings at some of its restaurants. KFC rolled out Hot Wings a year later, and Domino's Pizza introduced its own wings in 1994. They've remained hot ever since. McDonald's is back in the wing business this year, currently testing its Mighty Wings in 500 Chicago-area locations.
Chicken Wings and Football – A love story
The rise of the chicken wing and its correlation to American football all had to do with timing.
Cooking the whole bird was trendy in the sixties and seventies, but in the eighties U.S. consumers started preferring boneless-skinless breast meat, and wings became an inexpensive byproduct for chicken producers. Restaurants and bars realized they could charge low prices for the relatively inexpensive protein, and due to the spicy/salty nature of the sauce, they discovered that beer sales would go through the roof when customers ate wings.
At the same time, sports bars with multiple TVs and satellite dishes were becoming more and more common in America thanks to rapidly developing technology; and the most popular sporting event to watch with friends in bars is football. Wings were easily shareable and affordable, a great "group food" to eat with other people, and are the perfect pairing with a pitcher of beer. And so the relationship was born.
 PR Newswire (http://s.tt/1yNpm)

 PR Newswire
 PR Newswire
 PR Newswire
 PR Newswire
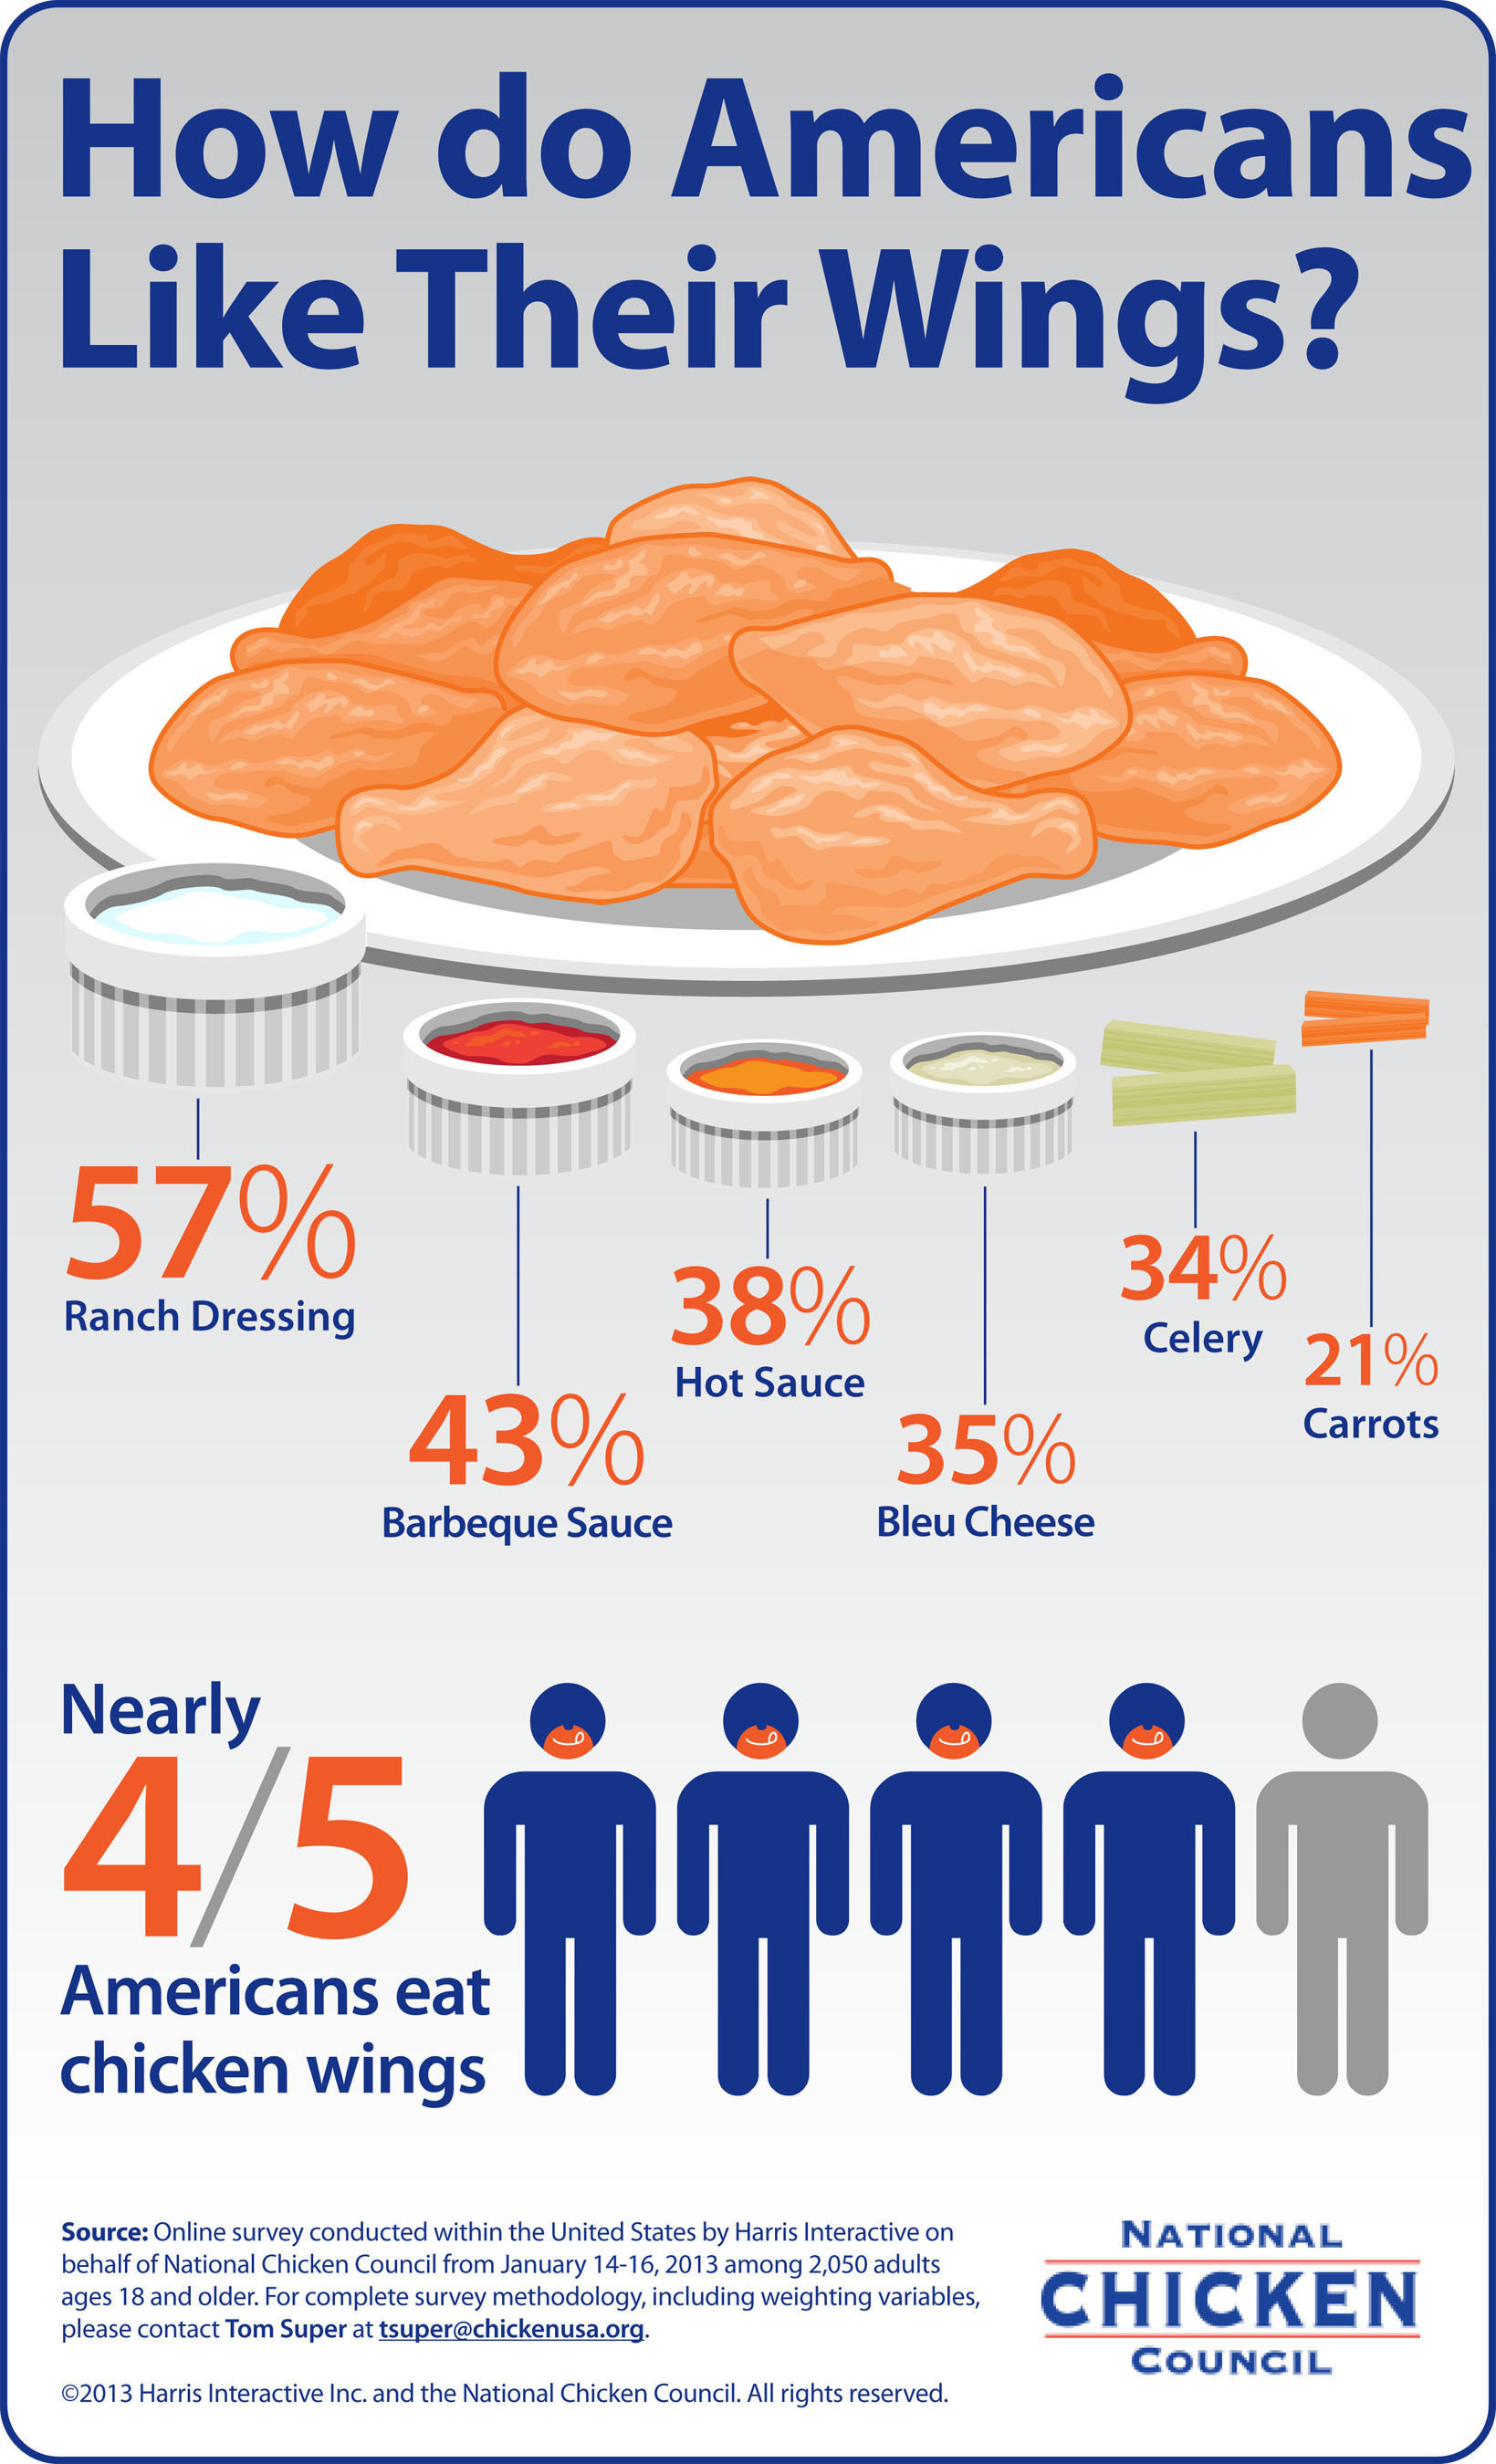
 PR Newswire
 PR Newswire
 PR Newswire
 PR Newswire


 PR Newswire