Zillow®, the leading real estate information and home-related marketplace, now allows homeowners to see an immediate change to their Zestimate® home value when they edit facts about their home on Zillow. Previously, it took as long as several weeks for the Zestimate to update.
Zillow calculates Zestimates for 100 million U.S. homes using a sophisticated and proprietary algorithm that incorporates millions of data points from public record and user-submitted data. Since 2006, Zillow's community of users has updated more than 50 million homes, significantly enhancing Zillow's living database of all U.S. homes and adding rich data beyond what is available anywhere else.
Today, when a homeowner updates the number of bedrooms, bathrooms, square footage, lot size, year built or structural remodel yeari, the algorithm will immediately recognize those changes and update the Zestimate accordingly. The change in estimated value will depend on several factors, including the home's location and the breadth of changes to a home's facts.
"We created the Zestimate because we think giving people a starting point for determining a home's worth is incredibly important and useful," said Stan Humphries, Zillow chief economist. "However, our algorithm has no way of knowing as much about a given property as the people that own it, which is why we enable homeowners to provide the most up-to-date information about their home, and why it is important to have the Zestimate reflect that information in real time."
Editing home facts is easy. Homeowners first need to claim their home on Zillow.com or a Zillow mobile app by clicking "edit" on their home details page, and follow the simple prompts. Once a home is claimed and confirmed, homeowners can update their home facts.
Zillow
Zillow® is the leading real estate and rental marketplace dedicated to empowering consumers with data, inspiration and knowledge around the place they call home, and connecting them with the best local professionals who can help. Zillow serves the full lifecycle of owning and living in a home: buying, selling, renting, financing, remodeling and more. In addition to Zillow.com®, Zillow operates the most popular suite of mobile real estate apps, with more than two dozen apps across all major platforms. Launched in 2006, Zillow is owned and operated by Zillow Group (NASDAQ: Z), and headquartered in Seattle.
Zillow, Zestimate and Zillow.com are registered trademarks of Zillow, Inc.
i A structural remodel is when a change in the home is significant enough to change your home facts such as bedrooms, bathrooms or square footage and adds at least 10% to the home's square footage.
Improved buyer demand at the beginning of 2015 pushed pending home sales in January to their highest level since August 2013, according to the National Association of Realtors®. All major regions except for the Midwest saw gains in activity in January.
The Pending Home Sales Index,* a forward-looking indicator based on contract signings, climbed 1.7 percent to 104.2 in January from an upwardly revised 102.5 in December and is now 8.4 percent above January 2014 (96.1). This marks the fifth consecutive month of year-over-year gains with each month accelerating the previous month's gain.
Lawrence Yun is chief economist and senior vice president of research at the National Association of Realtors(r). Yun oversees and is responsible for...
Lawrence Yun, NAR chief economist, says for the most part buyers in January were able to overcome tight supply to sign contracts at a pace that highlights the underlying demand that exists in today's market. "Contract activity is convincingly up compared to a year ago despite comparable inventory levels," he said. "The difference this year is the positive factors supporting stronger sales, such as slightly improving credit conditions, more jobs and slower price growth."
Yun also points to more favorable conditions for traditional buyers entering the market. All-cash sales and sales to investors are both down from a year ago1, creating less competition and some relief for buyers who still face the challenge of limited homes available for sale.
"All indications point to modest sales gains as we head into the spring buying season," says Yun. "However, the pace will greatly depend on how much upward pressure the impact of low inventory will have on home prices. Appreciation anywhere near double-digits isn't healthy or sustainable in the current economic environment."
The PHSI in the Northeast inched 0.1 percent to 84.9 in January, and is now 6.9 percent above a year ago. In the Midwest the index decreased 0.7 percent to 99.3 in January, but is 4.2 percent above January 2014.
Pending home sales experienced the largest increase in the South, up 3.2 percent to an index of 121.9 in January (highest since April 2010) and are 9.7 percent above last January. The index in the West rose 2.2 percent in January to 96.4 and is 11.4 percent above a year ago.
Total existing-homes sales in 2015 are forecast to be around 5.26 million, an increase of 6.4 percent from 2014. The national median existing-home price for all of this year is expected to increase near 5 percent. In 2014, existing-home sales declined 2.9 percent and prices rose 5.7 percent.
The National Association of Realtors®, "The Voice for Real Estate," is America's largest trade association, representing 1 million members involved in all aspects of the residential and commercial real estate industries.
1According to NAR's January Realtors® Confidence Index, all-cash sales were 27 percent of sales, down from 33 percent in January 2014. Sales to investors represented 17 percent of the market in January, down from 20 percent a year ago.
*The Pending Home Sales Index is a leading indicator for the housing sector, based on pending sales of existing homes. A sale is listed as pending when the contract has been signed but the transaction has not closed, though the sale usually is finalized within one or two months of signing.
The index is based on a large national sample, typically representing about 20 percent of transactions for existing-home sales. In developing the model for the index, it was demonstrated that the level of monthly sales-contract activity parallels the level of closed existing-home sales in the following two months.
An index of 100 is equal to the average level of contract activity during 2001, which was the first year to be examined. By coincidence, the volume of existing-home sales in 2001 fell within the range of 5.0 to 5.5 million, which is considered normal for the current U.S. population.
The economy is poised for a pickup in growth in 2015 amid a strengthening employment sector, rising income growth, and declining commodity prices, according to Fannie Mae's (OTC Bulletin Board: FNMA) Economic & Strategic Research (ESR) Group. The labor market has started the year on an upbeat note and is expected to lift consumer confidence, in turn helping to boost consumer spending, manufacturing activity, and the pace of the housing recovery. Economic growth may face some headwinds as a strong U.S. dollar weighs on the trade deficit. However, the economy is expected to climb to 2.9 percent for the full year, up from 2.5 percent growth in 2014.
"Our forecast calls for an increase in economic growth to 2.9 percent for 2015, which is a slight downward adjustment from our prior forecast but solid improvement nonetheless," said Fannie Mae Chief Economist Doug Duncan. "Although we are beginning this year at a more modest pace compared to the above-trend numbers seen at mid-year 2014, the country's aggregate income has benefitted from the improving labor market, which, combined with low gasoline prices, should help drive higher auto sales and overall consumer spending throughout 2015."
"We expect housing to shift up a gear in 2015 following the uneven and ultimately disappointing activity last year," said Duncan. "Our forecast calls for a number of factors, including strong hiring and income growth, stabilized housing affordability, and modestly easing lending standards, to translate into improving housing demand throughout the year. We continue to anticipate that the Fed will begin to hike short-term interest rates later this year, although weak global economic growth and geopolitical headwinds will likely limit the rise in long-term interest rates. We expect total home sales to increase by approximately 6.0 percent for 2015, with total single-family mortgage production climbing to approximately $1.2 trillion. Total single-family mortgage debt outstanding should be relatively flat this year before picking up gradually in 2016 and 2017."
Visit the Economic & Strategic Research site at www.fanniemae.com to read the full February 2015 Economic Outlook, including the Economic Developments Commentary, Economic Forecast, Housing Forecast, and Multifamily Market Commentary.
Opinions, analyses, estimates, forecasts, and other views of Fannie Mae's Economic & Strategic Research (ESR) Group included in these materials should not be construed as indicating Fannie Mae's business prospects or expected results, are based on a number of assumptions, and are subject to change without notice. How this information affects Fannie Mae will depend on many factors. Although the ESR Group bases its opinions, analyses, estimates, forecasts, and other views on information it considers reliable, it does not guarantee that the information provided in these materials is accurate, current, or suitable for any particular purpose. Changes in the assumptions or the information underlying these views could produce materially different results. The analyses, opinions, estimates, forecasts, and other views published by the ESR Group represent the views of that group as of the date indicated and do not necessarily represent the views of Fannie Mae or its management.
Coldwell Banker Real Estate LLC, the original San Francisco Bay area real estate start-up founded in 1906, continues its push to create exceptional experiences for home sellers. On the heels of its new digital platform allowing sellers to actively participate in the marketing of their home, the real estate brand is now launching an exclusive iPad application for its sales associates visualizing who a home's potential buyers are, from where they are moving and other market dynamics based on data from multiple public and private sources.
Highlights of the listing application include:
Big data from ESRI, Experian, OnBoard Informatics, Realtors Property Resources (RPR) and the U.S. Census Bureau that provides insight into home buyer profiles and trend analysis
Heat maps illustrating the top cities from which current home buyers in a market are moving and the percentage of home buyers in these neighborhoods who match a specific home's buyer profile
Tools that build a story for sellers about what is happening in their neighborhood and how that may affect their home and sale
A behind-the-scenes tool for how and why a listing should be priced that allows for customization based on neighborhood details and amenities
"For the first time ever, the Coldwell Banker brand is using big data to give sellers true insight into not just the potential pricing of their home, but likely to whom they will be selling it," said Sean Blankenship, chief marketing officer of Coldwell Banker Real Estate LLC. "Using big data in a very visual way, the application takes what Coldwell Banker affiliated sales associates are doing every day and adds insights and innovation that allow them to engage the seller in a confident discussion about the price of their home and how to sell it."
"CBx gives my company and sales associates one more thing that nobody else can provide," said Terri King, president and chief executive officer of Coldwell Banker King in North Carolina and a participant in the app's beta test. "The home buyer profiles and market data take our listing presentations to the next level by showing sellers something they haven't seen from other sales associates."
Home Buyer Profiles and Trends Big data allows CBx to present a demographic makeup of potential home buyers by attributes such as age, education, family size and average household income, as well as from where these potential home buyers are moving.
Insight into Market Data Data from Coldwell Banker Intelligence provides localized information on housing trends including average home value, total housing units, percentage of households changing owners and more.
Visual Overview and Mapping Google maps visually summarize the top regions from which current home buyers in a market are moving and the percentage of home buyers in these regions that match a specific home's buyer profile.
PricingIn partnership with Realtors Property Resource (RPR), a wholly owned subsidiary corporation of The National Association of Realtors, CBx is the first application to pull data directly from the RPR Broker AVM to provide an estimated value for any given home. The app also allows sales associates to make price adjustments based on their knowledge of the market and the home's amenities, such as increasing a home's price because of a spectacular view.
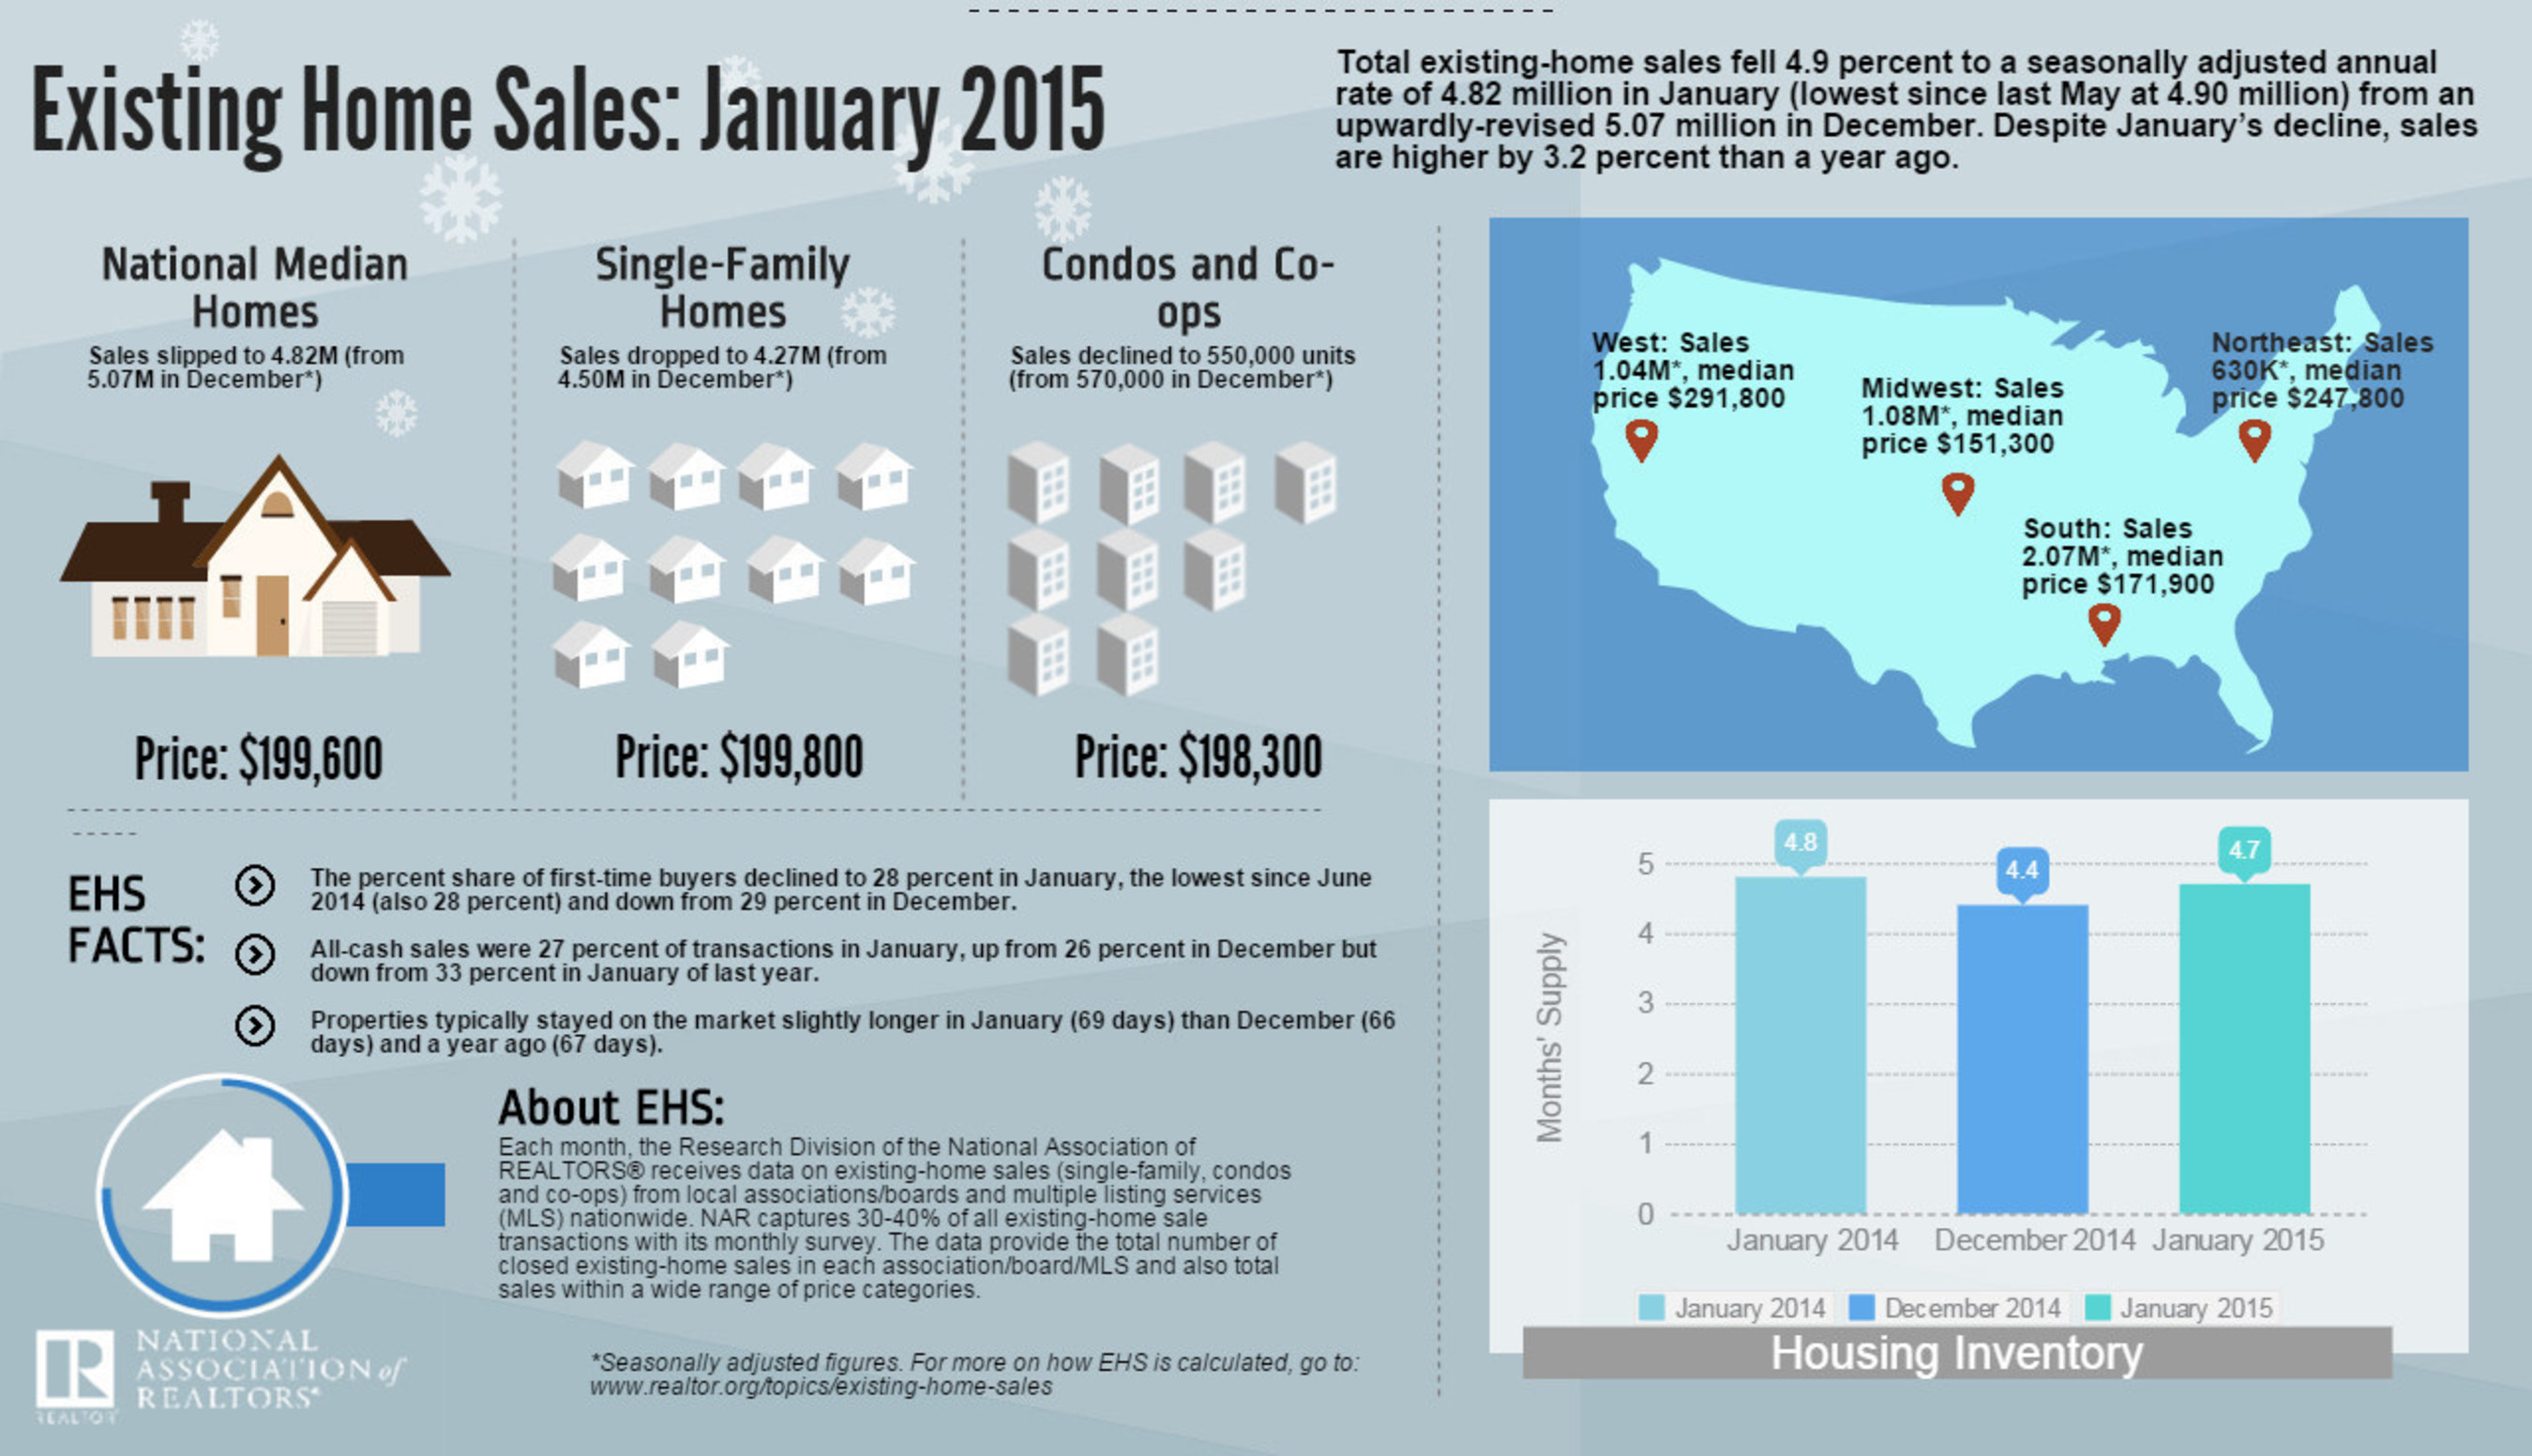
Existing-home sales declined in January to their lowest rate in nine months, but the pace was higher than a year ago for the fourth straight month, according to the National Association of Realtors®. All major regions experienced declines in January, with the Northeast and West seeing the largest.
Total existing-home sales1, which are completed transactions that include single-family homes, townhomes, condominiums and co-ops, fell 4.9 percent to a seasonally adjusted annual rate of 4.82 million in January (lowest since last May at 4.90 million) from an upwardly-revised 5.07 million in December. Despite January's decline, sales are higher by 3.2 percent than a year ago.
Existing-Home Sales Cool in January
Lawrence Yun is chief economist and senior vice president of research at the National Association of Realtors(r). Yun oversees and is responsible for...
Lawrence Yun, NAR chief economist, says the housing market got off to a somewhat disappointing start to begin the year with January closings down throughout the country. "January housing data can be volatile because of seasonal influences, but low housing supply and the ongoing rise in home prices above the pace of inflation appeared to slow sales despite interest rates remaining near historic lows," he said. "Realtors® are reporting that low rates are attracting potential buyers, but the lack of new and affordable listings is leading some to delay decisions."
Total housing inventory2 at the end of January increased 0.5 percent to 1.87 million existing homes available for sale, but is 0.5 percent lower than a year ago (1.88 million). Unsold inventory is at a 4.7-month supply at the current sales pace – up from 4.4 months in December.
The median existing-home price3 for all housing types in January was $199,600, which is 6.2 percent above January 2014. This marks the 35th consecutive month of year-over-year price gains.
"Although sales cooled in January, home prices continued solid year-over-year growth," adds Yun. "The labor market and economy are markedly improved compared to a year ago, which supports stronger buyer demand. The big test for housing will be the impact on affordability once rates rise."
According to Freddie Mac, the average commitment rate for a 30-year, conventional, fixed-rate mortgage in January fell to 3.67 percent, its lowest level since May 2013 (3.54 percent), and down from 3.86 percent in December. The average annual rate was 4.17 percent in 2014.
The percent share of first-time buyers declined to 28 percent in January, the lowest since June 2014 (also 28 percent) and down from 29 percent in December. First-time buyers represented 26 percent of sales last January.
NAR President Chris Polychron, executive broker with 1st Choice Realty in Hot Springs, Ark. says that the Federal Housing Administration's overly restrictive approval process limits buyers' access to condos even though these properties are among the strongest in the agency's portfolio. "Condominiums offer an affordable option and are the first step to homeownership for many homebuyers," said Polychron. "NAR has urged the FHA to develop policies that will give buyers access to more flexible and affordable financing opportunities and a wider choice of approved condo developments."
All-cash sales were 27 percent of transactions in January, up from 26 percent in December but down from 33 percent in January of last year. Individual investors, who account for many cash sales, purchased 17 percent of homes in January, unchanged from last month and below January 2014 (20 percent). Sixty-seven percent of investors paid cash in January.
Distressed sales5 – foreclosures and short sales – were 11 percent of sales in January, unchanged from last month but down from 15 percent a year ago. Eight percent of January sales were foreclosures and 3 percent were short sales. Foreclosures sold for an average discount of 15 percent below market value in January (unchanged from December), while short sales were discounted 12 percent (also unchanged from last month).
Properties typically stayed on the market slightly longer in January (69 days) than December (66 days) and a year ago (67 days). Short sales were on the market the longest at a median of 128 days in January, while foreclosures sold in 63 days and non-distressed homes took 68 days. Thirty percent of homes sold in January were on the market for less than a month.
Single-family and Condo/Co-op Sales
Single-family home sales dropped 5.1 percent to a seasonally adjusted annual rate of 4.27 million in January from 4.50 million in December, but are 3.9 percent above the 4.11 million pace a year ago. The median existing single-family home price was $199,800in January, up 6.3 percent from January 2014.
Existing condominium and co-op sales declined 3.5 percent to a seasonally adjusted annual rate of 550,000 units in January from 570,000 in December, and are now 1.8 percent below a year ago. The median existing condo price was $198,300 in January, which is 5.3 percent higher than a year ago.
Regional Breakdown
January existing-home sales in the Northeast fell 6.0 percent to an annual rate of 630,000, but are 3.3 percent above a year ago. The median price in the Northeast was $247,800, which is 2.7 percent above a year ago.
In the Midwest, existing-home sales declined 2.7 percent to an annual level of 1.08 million in January, but are still 0.9 percent aboveJanuary 2014. The median price in the Midwest was $151,300, up 8.2 percent from a year ago.
Existing-home sales in the South decreased 4.6 percent to an annual rate of 2.07 million in January, but are still 5.6 percent aboveJanuary 2014. The median price in the South was $171,900, up 7.4 percent from a year ago.
Existing-home sales in the West dropped 7.1 percent to an annual rate of 1.04 million in January, but are still 1.0 percent above a year ago. The median price in the West was $291,800, which is 7.2 percent above January 2014.
NOTE: For local information, please contact the local association of Realtors® for data from local multiple listing services. Local MLS data is the most accurate source of sales and price information in specific areas, although there may be differences in reporting methodology.
1Existing-home sales, which include single-family, townhomes, condominiums and co-ops, are based on transaction closings from Multiple Listing Services. Changes in sales trends outside of MLSs are not captured in the monthly series. NAR rebenchmarks home sales periodically using other sources to assess overall home sales trends, including sales not reported by MLSs.
Existing-home sales, based on closings, differ from the U.S. Census Bureau's series on new single-family home sales, which are based on contracts or the acceptance of a deposit. Because of these differences, it is not uncommon for each series to move in different directions in the same month. In addition, existing-home sales, which account for more than 90 percent of total home sales, are based on a much larger data sample – about 40 percent of multiple listing service data each month – and typically are not subject to large prior-month revisions.
The annual rate for a particular month represents what the total number of actual sales for a year would be if the relative pace for that month were maintained for 12 consecutive months. Seasonally adjusted annual rates are used in reporting monthly data to factor out seasonal variations in resale activity. For example, home sales volume is normally higher in the summer than in the winter, primarily because of differences in the weather and family buying patterns. However, seasonal factors cannot compensate for abnormal weather patterns.
Single-family data collection began monthly in 1968, while condo data collection began quarterly in 1981; the series were combined in 1999 when monthly collection of condo data began. Prior to this period, single-family homes accounted for more than nine out of 10 purchases. Historic comparisons for total home sales prior to 1999 are based on monthly single-family sales, combined with the corresponding quarterly sales rate for condos.
2Total inventory and month's supply data are available back through 1999, while single-family inventory and month's supply are available back to 1982 (prior to 1999, single-family sales accounted for more than 90 percent of transactions and condos were measured only on a quarterly basis).
3The median price is where half sold for more and half sold for less; medians are more typical of market conditions than average prices, which are skewed higher by a relatively small share of upper-end transactions. The only valid comparisons for median prices are with the same period a year earlier due to seasonality in buying patterns. Month-to-month comparisons do not compensate for seasonal changes, especially for the timing of family buying patterns. Changes in the composition of sales can distort median price data. Year-ago median and mean prices sometimes are revised in an automated process if additional data is received.
The national median condo/co-op price often is higher than the median single-family home price because condos are concentrated in higher-cost housing markets. However, in a given area, single-family homes typically sell for more than condos as seen in NAR's quarterly metro area price reports.
4Distressed sales (foreclosures and short sales), days on market, first-time buyers, all-cash transactions and investors are from a monthly survey for the NAR's Realtors® Confidence Index, posted at Realtor.org.
Mortgage rates continue to rise this week, with the benchmark 30-year fixed mortgage rate climbing to 3.96 percent, according to Bankrate.com's weekly national survey. The 30-year fixed mortgage has an average of 0.30 discount and origination points.
The average 15-year fixed mortgage increased to 3.21 percent while the larger jumbo 30-year fixed mortgage hit a 2-month high of 4.11 percent. Adjustable rate mortgages were mixed, with the 5-year ARM dipping slightly to 3.31 percent and the 7-year ARM inching up to 3.52 percent.
Mortgage rates climbed again as U.S. economic performance has been convincing enough to increase the odds of a June interest rate hike by the Federal Reserve. Mortgage rates had fallen as the year got under way on concerns over international growth. Those concerns haven't gone away, and in fact have increased with Ukraine and Greece now drawing attention. However, these international concerns are being overshadowed by the increased likelihood of a mid-year Fed interest rate hike. Mortgage rates are closely related to yields on long-term government bonds.
One year ago, the average 30-year fixed mortgage rate was 4.48 percent. At that time, a $200,000 loan would have carried a monthly payment of $1,011.00. With the average rate now at 3.96 percent, the monthly payment for the same size loan would be $950.22, a savings of $61 per month for anyone refinancing now.
SURVEY RESULTS
30-year fixed: 3.96% -- up from 3.90% last week (avg. points: 0.30) 15-year fixed: 3.21% -- up from 3.17% last week (avg. points: 0.19) 5/1 ARM: 3.31% -- down from 3.32% last week (avg. points: 0.21)
Bankrate's national weekly mortgage survey is conducted each Wednesday from data provided by the top 10 banks and thrifts in the top 10 markets.
The survey is complemented by Bankrate's weekly Rate Trend Index, in which a panel of mortgage experts predicts which way the rates are headed over the next seven days. Just under half of the panelists, 46 percent, expect mortgage rates to continue to climb. Thirty –one percent forecast that mortgage rates will remain more or less unchanged, while the remaining 23 percent predict that mortgage rates will pull back over the next week.
The adage "youth is wasted on the young" doesn't apply to today's single, female Baby Boomers. In fact, 76 percent of single women over 55 feel younger than their age, according to new data from Del Webb, a national brand of PulteGroup, Inc. (NYSE: PHM), one of the nation's largest homebuilders.
The first data in a series of new results from the recently conducted Del Webb Baby Boomer Survey of single, Baby Boomer women, finds that 74 percent of respondents are as happy, or happier, than they were at age 35 and nearly half (45 percent) believe their best years are yet to come.
Building specifically for homebuyers ages 55 and older, Del Webb is America's largest builder of active adult communities with more than 50 Del Webb communities in 21 states. Of the 76 million Baby Boomers, recent U.S. Census data shows that as many as 28 million (or 37 percent) are single females. Del Webb has conducted more than ten Baby Boomer surveys since 1996. The 2015 Del Webb Baby Boomer Survey is the first time ever that the company has exclusively surveyed this unique demographic to take a closer look at who they are and what really matters to them.
"Boomer homebuyer preferences and trends have changed dramatically in the 55 years since the first Del Webb community opened, but none stand out more than this generation's movement toward an active lifestyle that rivals people half of their age," said Ryan Marshall, executive vice president of homebuilding operations, PulteGroup. "Single, female Boomers have emerged as a powerful demographic. They have diverse needs, and it is incumbent on us to develop communities that offer an overall experience that reflects all that they want out of life."
The study finds that the single, female Boomer demographic is incredibly confident. According to the 2015 Del Webb Baby Boomer Survey, not only do 80 percent of respondents rank having self-confidence as "very important," but 76 percent are more empowered now than they were at age 35. In fact, more than one-in-five (22 percent) say they also feel more attractive than they were at 35.
That confidence may be attributed to the fact that 54 percent of single, female Boomers are as active or more active today than they were at 35. The 2015 Del Webb Baby Boomer Survey shows that four-in-five (81 percent) of single, female Boomers rank being physically healthy as "very important," and 68 percent of respondents rank a healthy lifestyle as their first priority, after time with family and friends.
Healthy lifestyle habits among this demographic include a number of high-energy activities, including some that may be unexpected. Nearly two-thirds (59 percent) of respondents report exercising at least a few times a week, engaging in activities including:
Weight training (27 percent)
Hiking (19 percent)
Yoga (18 percent)
Biking (16 percent)
Swimming (14 percent)
Other activities mentioned by respondents include tai chi, free-style dancing and horseback riding, among others.
"The lifestyle that single, female Boomers are embracing may be surprising to some, but it embodies what we see every day among our residents and prospective homebuyers," said Lindy Oliva, division president, PulteGroup. "Understanding that Del Webb residents demand a lifestyle defined by independence, vibrancy, engagement and fulfillment, has shaped the community designs and amenities offered in Del Webb communities for the past five decades."
Additional data on this dynamic demographic will be released throughout the year, including sentiments related to dating, home preferences and financial security/retirement. For more information, visit www.pultegroupinc.com.
About the Del Webb Baby Boomer SurveyThe Del Webb Baby Boomer Survey polled 1,020 single, female U.S. adults ages 50-68. The survey was conducted online by Nielsen from December 1-8, 2014. Findings for the total sample are projectable to the universe of 50-68-year-old U.S. females. At a 95 percent confidence level, a margin of sample error of +/- 4 percent applies to the sample. Since 1996, Del Webb has conducted more than ten Baby Boomer surveys to better understand this large, powerful demographic.
When you find your dream home and
are ready to write the offer, price is usually the first thing you think about
when it comes to negotiation. But price isn’t the only negotiation point on the
table. Here is a list of other points to consider in your offer:
Option period. The option
period gives you, the buyer, the unrestricted right to terminate the contract
during that period. Sellers usually are monetarily compensated in exchange for
this right. How much the compensation is and for how long the option period
lasts are negotiable. In a fast-paced market, sellers like to see shorter
inspection periods, rather than longer ones. Still you need to make sure you
give yourself enough time to get the home inspected and finish other due
diligence.
Contingencies.
Most contracts include contingencies such as financing or the sale of other
property. The financing contingency is the most common. However depending on
the market, contracts without contingencies are sometimes more favorable.
Title Policy. The title policy
is typically a seller’s expense, however, it can be negotiated. If you find
yourself in a multiple offer situation, paying for the seller’s policy may make
your offer more attractive. Your Realtor can advise you on this negotiation
strategy
Survey. Most
lenders require a valid survey. If the seller has a survey, that survey can
usually be used again if there have been no major changes to property
footprint. Examples of changes include moving the fence line, adding a pool,
extending the patio, etc. If a new survey is required, this is typically a
seller’s expense, but it can be negotiated.
Residential
Service Plan. We recommend that buyers ask the seller to purchase a residential
service plan. This is a common request and benefits both the buyer and seller. A
residential service plan is also sometimes called a “home warranty.”
Buyer Assistance.
Sometimes you need help paying for your closing costs. There are several ways
to negotiate this point. Your Realtor can advise you based on your situation and
the particular property you’re interested in.
Repairs. We
recommend that buyers have the property inspected by a state-licensed home
inspector. This inspection usually takes place during the option period. If the
home is in need of repairs, your Realtor will you advise how to proceed.
Possession. It is customary for
the buyer to give the sellers three days after the sale has closed to move, if
they haven’t already. However, if the seller needs to remain in the home
longer, this can be negotiated. For some sellers, this may be as important as
monetary negotiation points. For example, they may be waiting for a new home to
be completed or for a school break. If the home is vacant, possession is rarely
an issue.
Non Realty
Items. You can ask the seller to leave specific items that are considered
personal property. Common requests include wall-mounted TVs and big ticket
appliances such as the refrigerator. If you’d like to ask for personal property,
your Realtor can advise you on the request.
Expressing one's love to another is a celebrated custom on Valentine's Day. Sweethearts and family members present gifts to one another, such as cards, candy, flowers and other symbols of affection. Opinions differ as to who was the original Valentine, but the most popular theory is that he was a clergyman who was executed for secretly marrying couples in ancient Rome. In A.D. 496, Pope Gelasius I declared Feb. 14 as Valentine Day. Esther Howland, a native of Massachusetts, is given credit for selling the first mass-produced valentine cards in the 1840s. The spirit continues today with even young children exchanging valentine's cards with their fellow classmates.
Candy
1,379 Number of U.S. manufacturing establishments that produced chocolate products in 2012, employing 37,998 people. California led the nation with 152 of these establishments, followed by New York, with 119. Source: U.S. Census Bureau, County Business Patterns: 2012, NAICS code (31135)http://factfinder2.census.gov/bkmk/table/1.0/en/BP/2012/00A1/naics~31135
445 Number of U.S. establishments that manufactured nonchocolate confectionary products in 2012. These establishments employed 20,419 people. California led the nation in this category with 46 establishments. Source: U.S. Census Bureau, County Business Patterns: 2012, NAICS code (31134) http://factfinder2.census.gov/bkmk/table/1.0/en/BP/2012/00A1/naics~31134
$294,730,180The value of imports for cut flowers and buds for bouquets in 2014 through November. The total value of fresh cut roses as ofOctober 2014 was $407,807,220. Source: U.S. Census Bureau: Foreign Trade Division USA Trade Online U.S. Import and Export Merchandise trade (Commodity code-060319 and 060311) https://usatrade.census.gov/
29.0 and 26.6 years Median age at first marriage in 2013 for men and women, respectively. Source: U.S. Census Bureau, Families and Living Arrangements: 2013, http://www.census.gov/hhes/families/data/marital.html Table MS-2
68.6% Percentage of people 15 and older in 2013 who had been married at some point in their lives — either currently or formerly. Source: U.S. Census Bureau, Families and Living Arrangements: 2013, http://www.census.gov/hhes/families/data/cps2013A.html Table A1
36.9The provisional rate of marriages per 1,000 people performed in Nevada during 2011. So many couples tie the knot in the Silver State that it ranked number one nationally in marriage rates. Hawaii ranked second with a marriage rate of 17.6. Source: National Center for Health Statistics, http://www.cdc.gov/nchs/data/dvs/marriage_rates_90_95_99-11.pdf
2.1 million The provisional number of marriages that took place in the United States in 2011. That breaks down to nearly 5,800 a day. Source: National Center for Health Statistics, http://www.cdc.gov/nchs/fastats/marriage-divorce.htm
74.5% The percentage of women who married for the first time between 1990 and 1994, who reached their 10th anniversary. This compares with 82.8 percent of women who married for the first time between 1960 and 1964. Men who married for the first time between 1990 and 1994, who reached their 10th anniversary was 77.3 percent. This compares with 83.4 percent who married for the first time between 1960 and 1964. Source: U.S. Census Bureau, Number, Timing, and Duration of Marriages and Divorces: 2009, http://www.census.gov/prod/2011pubs/p70-125.pdf Table 4
8 Median length, in years, of first marriages that ended in divorce. Source: Number, Timing, and Duration of Marriages and Divorces: 2009 http://www.census.gov/prod/2011pubs/p70-125.pdf Table 8
3.8 and 3.7 The median time in years between divorce and a second marriage for men and women, respectively. However, the two medians are not statistically different from each other. Source: Number, Timing, and Duration of Marriages and Divorces: 2009 http://www.census.gov/prod/2011pubs/p70-125.pdf Table 8
9% and 7.9% Among people 15 and older in 2009, the percentage of men and women, respectively, who had married twice and were still married. Source: Number, Timing, and Duration of Marriages and Divorces: 2009 http://www.census.gov/prod/2011pubs/p70-125.pdf Table 6
Looking for Love
393 The number of dating service establishments nationwide as of 2007. These establishments, which include Internet dating services, employed 3,125 people and pulled in $928 million in revenue. Source: U.S. Census Bureau, 2007 Economic Censushttp://factfinder2.census.gov/bkmk/table/1.0/en/ECN/2007_US/00A1//naics~8129902
Try Looking Here . . .Romantic-sounding places to spend Valentine's Day: