Showing posts with label Back to School. Show all posts

Friday, August 19, 2016

5 Tips to Keep Your Kids Fueled After School

Food expert Laura Fuentes and Lance® sandwich crackers urge moms to have the right strategies and snacks on hand to keep after-school hunger at bay

fter a long day at school, the first thing kids usually say when they get home is "Mom, I'm hungry." Lance® sandwich crackers, which has been fueling America with two awesome crackers and an incredible filling in the middle for more than 100 years, has partnered with Laura Fuentes, cookbook author, food blogger and founder ofMOMables, to help moms fight after-school hunger and keep kids going until dinnertime.
"Considering most kids get just 20 minutes to eat lunch, and some as early as 10:30 in the morning, after-school hunger becomes a big problem," says Fuentes.
Here are Laura's five tips to keep after-school hunger at bay: 
Plan ahead.Adding extras to lunch keeps things interesting for kids, plus helps them feel full for longer. Plan ahead to keep hunger pangs at bay all day.
"By adding premade frozen smoothies inside my kids' lunchboxes, I'm able to keep their lunch cool, plus they quench thirst and satisfy hunger at the same time," says Fuentes.
Have portable snacks ready.A balanced snack that can be eaten on-the-go is a life saver. Pack the pantry with wholesome options that both parents and kids love. Additionally, don't overlook fresh fruit that is both healthy and portable.
"I love pairing Lance Peanut Butter Sandwich Crackers with apple slices," says Fuentes. "They have up to 5 grams of protein, plus are made with real peanut butter and cheddar cheese — a combination kids just love."
A snack like Lance Sandwich Crackers, which also offers gluten-free and whole-grain options, is conveniently wrapped in individual packs, making on-the-go snacking easy between activities.
Pack a balanced lunch. Balancing the lunchbox can help ensure kids stay satiated longer. Make sure to include protein, healthy fats and carbohydrates, fresh fruits and vegetables in every lunch you pack.
"School lunch breaks are shorter than ever, so cutting up foods into smaller pieces can make it easier and quicker to eat," Fuentes says. "Additionally, dividing the foods sent to school in multiple containers distributes the food for different break periods."
Make a wholesome breakfast.Many kids come home starving because they haven't eaten enough to fuel their day. Making breakfast part of your morning routine is essential for setting kids up for success.
"Two of my favorite easy and portable breakfast ideas that can be made ahead of time are quick breakfast burritos and overnight oats," says Fuentes. "They provide just the right amount of fuel and protein to help kids focus in school."
Rule out thirst."Since thirst can often masquerade as hunger, it's important to have water available at all times," Fuentes says.
Try tucking an extra water bottle in your kid's backpack and offer a cup immediately when they get home. To encourage kids to drink more water, add a touch of flavor and color by placing fresh orange slices or berries inside their cup.

Thursday, August 18, 2016

7 One-Pot Recipes for Back-to-School Season


School is back in session, and so are hectic weeknights with little time to cook dinner. Instead of reaching for ready-made meals or takeout, serve up tasty one-pot dinners made with wholesome ingredients like spaghetti squash and quinoa. These seven kid-friendly recipes bring everything together in a single baking dish or skillet, so there's less prep and clean up, and more time for reconnecting around the dinner table.

  1. Spaghetti Squash Shrimp Lo Mein – Load up on veggies with this weeknight version of an Asian takeout favorite. Carrots, bell pepper and shrimp are flavored with soy sauce, ginger and garlic. Try a microwave shortcut to cook the spaghetti squash and have it on the table in no time.
  2. Fall Skillet Pot Pie – Rotisserie or leftover chicken, refrigerated biscuits and an oven-proof skillet make this comfort food favorite a weeknight reality. Add sweet potatoes, peas and flavor with thyme, cinnamon and garlic powder.
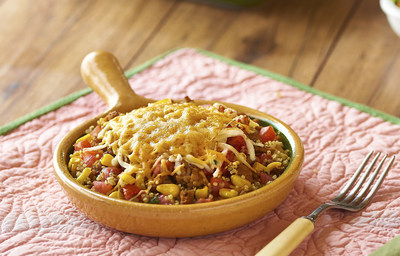
  3. Quinoa Taco Skillet – McCormick Organics Taco Seasoning Mix adds kid-friendly flavor to this skillet dinner made with quinoa, ground turkey, fresh tomatoes and corn.
  4. Creamy Tomato Italian Parmesan Chicken – Tender chicken simmered in a creamy red sauce, fresh parmesan and freshly ground Italian herbs make for a perfect weeknight dish. Whether you serve with pasta, atop Italian bread or let the chicken be the star, this dish is a guaranteed crowd-pleaser.
  5. Chicken Noodle Casserole – Everyone's favorite soup gets a casserole treatment. Simply combine pasta, chicken, vegetables and gooey cheese with the flavors of pepper, garlic and Italian seasoning for a comforting weeknight meal, perfect for leftovers.
  6. Chicken Fajita Soup – Warm up with a one-pot wonder that gets a Tex-Mex twist from McCormick Organics Fajita Seasoning Mix. Let the family customize with toppings like avocado, cheese, sour cream and tortilla strips.
  7. Chicken Chili with Apple and Sweet Potato – Say goodbye to beans and whip up a new fall chili the whole family will love. Kitchen Basics Organic Chicken Stock gives the quick dish a rich, cooked-all-day flavor.
Find more tips and recipe inspiration for back-to-school season at McCormick.com and be sure to check out Pinterest andFacebook.

Sunday, August 7, 2016

How to Pack Healthy School Lunches and Snacks

Busy parents know that packing healthy lunches and snacks that kids will eat and not throw out or trade day after day is a challenge. For kids with food allergies – which, according to the CDC, is one in 13 kids or about two per classroom – or who attend a peanut-free school, it gets even more difficult.
Here are some tips for packing healthy and delicious allergy-friendly lunches and snacks that fuel kids' active minds and bodies all day long.
Send a Kid-Approved SnackThere will be birthdays and celebrations in school where the snacks may not be allergy-friendly. Talk with your child's teacher and make sure they understand his or her dietary restrictions. Send a snack they can eat for the teacher to keep on hand for these occasions. Or, if it's your child's birthday, send something delicious everyone can enjoy together.
One to try: EnviroKidz Granola Bars and Crispy Rice Bars, the first organic, gluten-free, peanut-free bars for kids, in tasty Chocolate Chip and Strawberry Granola Bars and Berry Blast and Chocolate Crispy Rice Bars. The strawberry and berry blast flavors are also dairy-free, and 1 percent of sales from all four flavors go to help endangered species.
Make It PositiveInstead of focusing on the things your child can't eat, focus on all of the delicious foods they can enjoy. You can look online for ideas and talk about them with your child, involving them in the process to come up with a list of things they love. Try gluten-free waffles instead of bread for sandwiches, nut-free butters like sunflower seed butter, smoothies or soups in a thermos, or fruit with dairy-free yogurt for dipping. Make sure to stock the fridge and pantry with these items so you can easily pack lunches without stress. You can even post the list on the refrigerator and let them choose what they want.
Go for the Gold Standard: OrganicIf your little one has allergies, it's important to think about lunches in a holistic way, not just avoiding certain foods.
"When packing allergy-friendly foods, considering the quality of all the ingredients, not just the ones it's 'free of,' is really important," said Ashley Koff, registered dietitian. "The easiest choice: organic ingredients, which means non-GMO, because they give you what the body recognizes easily and avoids ingredients that can detract from better nutrition and better health."
Make It FunJust because you are avoiding certain foods doesn't mean that lunch or snack time can't be delicious and fun. Pack foods in a variety of colors and shapes, including rolls and stacks. Use cookie cutters to make fun shapes and create pops, kebabs or other easy recipes that use kid- and allergy-friendly foods and make eating a blast. Additionally, a simple, sweet note or picture drawn on a napkin can be a nice lunchtime surprise.
Packing lunches and snacks for kids with allergies can be a challenge, but with some planning you can find delicious, nutritious foods your child will love. Find more allergy-friendly recipes and lunch and snack tips at envirokidz.com.
Fruit and Granola Bar Kebabs

Serves: 8-10
4- 5  
varieties of colorful fruits

Star or heart-shaped cookie cutter (optional)
1
box peanut-free EnviroKidz Granola Bars

kebab skewers
Wash and slice fruit into bite-size chunks large enough to withstand a skewer.
Use cookie cutter for fruit shape at top of kebab.
Once fruit is ready, cut up granola bars, about 3 squares each, and begin layering kebabs.
Serve immediately.

Thursday, September 3, 2015

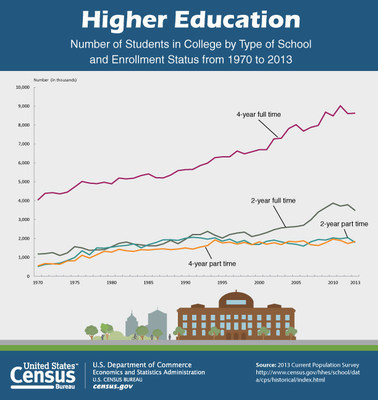
Summertime is winding down and vacations are coming to an end, signaling that back-to-school time is here. It's a time that many children eagerly anticipate — catching up with old friends and making new ones, and settling into a new daily routine. Parents and children alike scan newspapers and websites looking for sales on a multitude of school supplies and the latest clothing fads and essentials. This edition of Facts for Features highlights the many statistics associated with the return to classrooms by our nation's students and teachers.
Back-to-School Shopping
$8.2 billion  
The estimated amount of money spent at family clothing stores inAugust 2014. Sales at bookstores in August 2014 were estimated at$1.6 billion.
Source: U.S. Census Bureau, Monthly Retail Trade and Food Services
http://www.census.gov/retail/mrts/www/data/excel/mrtssales92-present.xls
For back-to-school shopping, choices of retail establishments abound: In 2013, there were 27,340 family clothing stores, 7,047 children and infants clothing stores, 25,100 shoe stores 6,998 office supply and stationery stores, 7,064 bookstores and 8,102 department stores. 
Source: U.S. Census Bureau, 2013 County Business Patterns, NAICS: 448140, 448130, 448210, 453210, 451211, 45211
http://factfinder.census.gov/bkmk/table/1.0/en/BP/2013/00A1//naics~44813|44814|448210|451211|4521|453210
Students
78 million The number of children and adults enrolled in school throughout the country in October 2013 — from nursery school to college. They comprised 25.9 percent of the entire population age 3 and older.
Source: U.S. Census Bureau, School Enrollment – Social and Economic Characteristics of Students: October 2013, Table 1
http://www.census.gov/hhes/school/data/cps/2013/tables.html
Pre-K through 12 Enrollment
48,299,727Fall enrollment for elementary and secondary public school systems in 2012. 
Source: U.S. Census Bureau, Public Elementary-Secondary School System Finances by Enrollment-Size Groups: Fiscal Year 2013- 2013 Annual Survey of School System Finances  
http://factfinder.census.gov/bkmk/table/1.0/en/SSF/2013/SSF013
$10,700 The amount of current spending per pupil for elementary and secondary public school systems in the United States in 2013. 
Source: U.S. Census Bureau, Per Pupil Amounts for Current Spending of Public Elementary-Secondary School Systems by State: Fiscal Year 2013 – United States – States – 2013 Annual Survey of School System Finances  
http://factfinder.census.gov/bkmk/table/1.0/en/SSF/2013/SSF008.US01
75% Percentage of children 3 to 6 years old who were enrolled in school as of October 2013.
Source: U.S. Census Bureau, School Enrollment – Social and Economic Characteristics of Students: October 2013, Table 3
http://www.census.gov/hhes/school/data/cps/2013/tables.html
77%  
Percentage of children ages 3 to 6 enrolled in kindergarten who attended all day, as of October 2013. 
Source: U.S. Census Bureau, School Enrollment – Social and Economic Characteristics of Students: October 2013, Table 3
http://www.census.gov/hhes/school/data/cps/2013/tables.html
25%   
Percentage of elementary through high school students who had at least one foreign-born parent in October 2013. 
Source: U.S. Census Bureau, School Enrollment – Social and Economic Characteristics of Students: October 2013, Table 1 
http://www.census.gov/hhes/school/data/cps/2013/tables.html
Languages
12 million Number of school-age children (5 to 17) who spoke a language other than English at home; 8.5 million of these children spoke Spanish at home. 
Source: U.S. Census Bureau, 2013 American Community Survey 
http://factfinder.census.gov/bkmk/table/1.0/en/ACS/13_1YR/B16004
Colleges
4,605The number of colleges, universities and professional schools in the United States in 2013. There were 1,006 junior colleges.
Source: U.S. Census Bureau, 2013 County Business Patterns
http://factfinder.census.gov/bkmk/table/1.0/en/BP/2013/00A1//naics~ALL-6112|ALL-6113
15% Percentage of college and graduate school students 35 and older in October 2013. They made up 33 percent of those attending school part time. 
Source: U.S. Census Bureau, School Enrollment – Social and Economic Characteristics of Students: October 2013, Table 5
http://www.census.gov/hhes/school/data/cps/2013/tables.html
40% Percentage of 18- to 24-year-olds enrolled in college or graduate school in 2013. 
Source: U.S. Census Bureau, School Enrollment – Social and Economic Characteristics of Students: October 2013, Table 1
http://www.census.gov/hhes/school/data/cps/2013/tables.html
Work Status
52% Percentage of students enrolled in college who worked less than full time, year-round in 2011; 20 percent worked full time, year-round.
Source: School Enrollment and Work Status: 2011, Appendix Table 1-A http://www.census.gov/prod/2013pubs/acsbr11-14.pdf
3.1 million Number of enrolled high school students who worked less than full time, year-round in 2011; 146,000 students in high school worked full time, year-round.
Source: School Enrollment and Work Status: 2011, Appendix Table 1-A http://www.census.gov/prod/2013pubs/acsbr11-14.pdf
Field of Degree
12.8 million Number of people age 25 and over who held a bachelor's degree in business in 2013. Business degrees were reported by 20.5 percent of the population with a bachelor's degree, followed by education (13.2 percent); science and engineering related fields (9.1 percent); engineering (7.8 percent); social sciences (7.7 percent); biological, agricultural and environmental sciences (6.1 percent); and liberal arts and history (5.1 percent). 
Source: U.S. Census Bureau, 2013 American Community Survey
http://factfinder.census.gov/bkmk/table/1.0/en/ACS/13_1YR/B15010
74% Percentage of those in 2012 who had a bachelor's degree in science, technology, engineering or math — commonly referred to as STEM — and were not employed in STEM occupations.
Source: U.S. Census Bureau, 2012 American Community Survey
http://www.census.gov/newsroom/press-releases/2014/cb14-130.html
Rewards of Staying in School
$82,720 Average earnings of full-time, year-round workers 18 and older with a bachelor's degree or higher in 2012. Workers whose highest degree was a bachelor's had mean earnings of $70,432. Mean earnings for full-time, year-round workers with a high school diploma (includes GED certificate) was $41,248, while workers with less than a ninth grade education had $26,679 average earnings.
Source: Income, Poverty, and Health Insurance Coverage in the United States: 2013, Series 
P60-245 http://www.census.gov/hhes/www/cpstables/032013/perinc/pinc04_000.htm

Tuesday, September 1, 2015

Play: It's Not Just Fun and Games

 As children head back to school, the time set aside for play seems to disappear. According to a survey conducted by Dr Pepper Snapple Group's Let's Play initiative, 56 percent of parents say busy schedules are a major barrier to play.
Play is an important part of a child's physical, emotional and social development. In fact, kids who play are found to be healthier, happier and better performers in school. As children's schedules become packed with activities during the school year, it is important to make sure they are getting enough active playtime each day to help them grow into happy, healthy adults.
Here are some reasons to keep kids active during the school year:
Play promotes social skills. According to a report from the Centers for Disease Control and Prevention, just more than a quarter of students surveyed participated in daily physical education classes. Kids have fewer opportunities to be active during the school day, so it is important to supplement their schedules with after-school activities or sports throughout the year. Team sports are a great opportunity for children to foster friendships and connect with kids from different backgrounds. Keeping your children active through sports gives them the opportunity to maintain a physically active lifestyle while also making new friends.
Play heightens intellectual development. Education in the classroom allows children to learn and grow; however, physical activity outside of the classroom is also important for a child's development. Studies show that physical play has been linked to helping kids think creatively and create connections with others through the process of sharing, negotiating and resolving conflicts. Such skills are vital for a child to learn and can be easily taught through active play.
Play enhances motor skills. Playgrounds serve as a great space for kids to explore and have fun in a safe environment while challenging and refining their motor skills. Interacting with play equipment helps build motor skills and improves self-control and coordination.
Play relieves stress. As kids get older, schoolwork becomes increasingly difficult and stress levels about the workload begin to rise. In fact, 46 percent of parents polled in the Let's Play survey said that a focus on academics was one of their kids' biggest barriers to play. While academics should always be a priority, giving kids the opportunity and time to play can relieve the stress associated with school and allow them to simply have fun. 
You can learn more about the importance of play and get tips and advice on how to incorporate active play in your child's everyday life at LetsPlay.com, where you can also nominate a community group, nonprofit or school to receive a new playground or sports equipment grant courtesy of Let's Play.

Saturday, August 22, 2015

Back-to-School Shoppers Slowly Tackling Lists This Summer

As families artfully craft their back-to-school shopping plans around promotions and even their state’s sales tax holiday, it seems there is still quite a bit of shopping left to be done. According to NRF’s latest Back-to-School Spending Survey conducted by Prosper Insights & Analytics, the average family with children in grades K-12 has completed just half (50.4%) of their shopping, which is even with results from last year’s survey (49.9%).

“As expected, families are carefully measuring where, when and how they should spend on fall apparel items, school supplies, electronics and other necessities,” said NRF President and CEO Matthew Shay. “Late summer promotions and sales tax holidays around the country are likely contributing to the delay in back-to-school shopping this year, which means the next few weeks could be exceptionally busy for retailers large and small.”

“Retailers, hoping to strike a chord with both budget-conscious and value-focused parents, will roll out hard to pass up promotions designed to capture the attention of those last-minute shoppers,” said Shay.
"As expected, families are carefully measuring where, when and how they should spend on fall apparel items, school supplies, electronics and other necessities."
Matthew Shay

Though fewer people this year admit that they have not yet started their shopping (19.5%) compared to last year (23.6%), it’s clear that most of those who have started shopping still have quite a bit left on their lists. A number of families, however, stated they already have everything they need for the first day of school with 13.3 percent saying that they have finished their shopping.

Coupons and promotions continue to resonate with today’s shopper, and the survey this year found that mom and dad certainly have done their own homework when it comes to the new supplies, apparel and electronic items on their lists: those who have already started shopping indicate that about half of their purchases (51.3%) were influenced by coupons, sales and promotions, down from 58 percent last year.

When it comes to classroom needs, the survey found parents are on the hook to contribute several items. On average, parents say that 64.4 percent of their purchases of pencils, folders and other school supplies are influenced by classroom lists or school requirements. In addition, 45.9 percent of their electronics purchases for back to school are influenced by the lists and requirements of their family’s schools.

“Given the extra costs some parents take on these days when it comes to stocking their children’s classroom, many will certainly look to take advantage of retailer’s sales and promotions as well as their state’s sales tax holidays as they wrap up their lists,” said Prosper’s Principal Analyst Pam Goodfellow. “More retailers than ever are in the back-to-school spectrum, so it won’t be difficult for mom and dad to find what they need wherever they shop, be it their favorite website for free shipping offers or their local drug store for last-minute deals on supplies.”

When asked what payment method families shopping for back-to-school used most often, 44.6 percent have or will use their debit cards, while others have or will swipe their credit cards (27.7%) or pay with cash (25.5%).

As for where consumers will finish their shopping, discount stores will see the most traffic (53.4%), while 46.8 percent will shop at department stores, 36.6 percent at clothing stores and 12.8 percent will wrap up at electronics stores; 27.2 percent will check out retailers’ best online deals, up from 24.8 percent this time last year.

In-store ads, coupons and promotions continue to be the big influencers for families shopping back to school. Parents say traditional media has the most impact, saying that coupons (43.4%), in-store promotions (35.3%) and advertising inserts (31%) influence them the most to shop at a particular store. Word of mouth (21.5%) and television ads (19.4%) also make a difference.


Families Shopping for College Necessities Waiting for Late-Season Deals, NRF Survey Finds

College shoppers are delaying the inevitable and waiting until absolutely necessary to fill up the family car with their college needs. NRF’s Back-to-College Spending Survey conducted by Prosper Insights & Analytics found college students and their families have completed about half (49.1%) of their shopping lists compared to 53.7 percent this time last year. Nearly one-quarter (24%) of those planning to shop for college necessities have been busy enjoying the summer days and have not yet begun their shopping, down slightly from last year (26.2%).

College shoppers are also turning to coupons, sales or promotions to get the best bang for their buck: the survey found nearly half (48.1%) of what parents have purchased has been influenced by early summer deals and promotions, which is the same as last year but higher than the 44.4 percent in 2013.

Many colleges and universities today require incoming and/or current students to come armed and ready with their own computer. The survey this year found 49 percent of the electronic items college students and their parents have already purchased were influenced by their class or school requirements, down from 56 percent last year.

While most back-to-college shoppers say that they have or will use debit cards to make purchases (41.8%), a number of shoppers have already or will use their credit cards (31.9%) or have chosen to pay with cash (22.1%) when buying supplies, apparel and electronic items for class.

Much like back-to-school shoppers, most of those shopping for college will cross off bedding, apparel and other items from their lists at discount stores (46.3%), department stores (38.8%), clothing (28.8%) and electronics stores (20.3%).

Traditional media also resonates well with back-to-college shoppers. The survey found four in 10 (42.3%) college shoppers agree coupons influence their purchases, and nearly three in 10 (27.6%) responding that in-store promotions and advertising inserts (26.2%) are also big influencers.

Thursday, July 16, 2015

After Splurging in 2014, Families Trim Back-to-School Spending for 2015


Average Spending on Back to School Has Grown 42 Percent in Past 10 Years


After spending more on school supplies and electronics in 2014, parents this year will head into the back-to-school season evaluating what their children really need before spending on new items. According to NRF’s Back-to-School Spending Survey conducted by Prosper Insights & Analytics, the average family with children in grades K-12 plans to spend $630.36 on electronics, apparel and other school needs, down from $669.28 last year. Total spending is expected to reach $24.9 billion. Additionally, indicating the continued growth in the back-to-school arena, families on average have spent 42 percent more on school items over the past 10 years.

Regardless of the slight decrease, survey results point to a more confident consumer when it comes to spending and the impact of the economy. The survey found 76.4 percent of families with school-age children say they will change their spending because of the economy, the lowest in the seven years NRF has been tracking it, and down from 81.1 percent last year.

“As seen over the last 13 years, spending on ‘back to school’ has consistently fluctuated based on children’s needs each year, and it’s unlikely most families would need to restock and replenish apparel, electronics and supplies every year,” said NRF President and CEO Matthew Shay. “Parents this summer will inventory their children’s school supplies and decide what is needed and what can be reused, which just makes good budgeting sense for families with growing children."

“Heading into the second half of the year, we are optimistic that economic growth and consumer spending will improve after a shaky first half of the year,” said Shay.

As Economy Improves, Impact on Spending Lessen

Solid growth in job creation and consumer confidence have greatly contributed to the economic recovery, which could be positively impacting how families shop for school items this year. The survey found 40.6 percent of those who say the economy is impacting their spending plans will look for sales more often, down from the 46.2 percent last year and the lowest since NRF began tracking this in 2009. Additionally, 29.8 percent will buy more generic or store brand products, down from 34 percent last year and another survey low.

For those who have to restock what their children need for school, 92.7 percent will purchase new apparel, spending an average of $217.82, though most (94.1 percent) will head out for new school supplies, spending an average of $97.74; families will also spend $117.56 on new shoes.

In 2014, 58.3 percent of parents said they would buy electronics for their school-age children, and planned to spend an average of $212.35 — one of the highest amounts seen in the survey’s history. Having less of a need for electronics this year, however, families said they would decrease their spending on gadgets for their children and will spend an average of $197.24.


Source: 2015 NRF Back to School/College Spending Survey conducted by Prosper Insights & Analytics.
"Heading into the second half of the year, we are optimistic that economic growth and consumer spending will improve after a shaky first half of the year."
NRF President and CEO
Matthew Shay


Early Birds Change Course; Omnichannel Offerings Desired by Shoppers

More families with children in grades K-12 are opting to wait before rushing out to shop. According to the survey, 19.6 percent will shop at least two months before school, down from 22.5 percent last year. Starting a little later this year, two in five (42.8 percent) will shop at least three weeks to one month before school, down slightly from 44.5 percent last year. More families (30.3 percent) will shop one to two weeks before school, up from 25.4 percent last year.

When asked why they begin shopping for back to school at least two months out, 64.9 percent said they shop early to spread out their budgets, and half (51.1 percent) do so to avoid crowds associated with school shopping. Other popular reasons include not wanting to miss out on popular merchandise (21.5 percent) and prices and promotions being too good to pass up (45.3 percent).

Planning to shop around for their school merchandise, families will head to their local department (56.4 percent), discount (62.2 percent), clothing (53.5 percent), electronics (22.4 percent) and office supply stores (35.9 percent). And slightly more than one-third (35.6 percent) of those looking for school items will shop online.

For the first time, NRF asked about shoppers’ intentions to use retailers’ omnichannel offerings; of those planning to shop online, nearly half (48.4 percent) say they will take advantage of retailers’ buy online, pick up in store or ship to store options, and 17.3 percent will look for expedited shipping offers. Nine in 10 (92.1 percent) will take advantage of retailers’ free shipping offers.

“Savvy and budget-conscious parents today have plenty of experience when it comes to looking around for great deals and value-add promotions, and it seems mom and dad will use that to their advantage this summer to take advantage of retailers’ omnichannel services,” said Prosper’s Principal Analyst Pam Goodfellow. “To ease hectic schedules and long shopping lists, it’s likely that we’ll continue to see consumers try out and regularly use services like free shipping, reserve online and even same-day delivery — options busy parents have been waiting for.”

Broken out by age, Millennials are much more likely to use these channels: Two-thirds of 18-24- and 25-34-year-olds will use a buy online, pick up in store or ship to store option (65.7 percent and 65 percent respectively), and 15.4 percent of 25-34-year-olds will use a reserve online option, much higher than the 9.1 percent of average adults who plan to do so. Additionally, 23 percent of 18-24-year-olds will use same-day delivery, significantly more than the 10.2 percent of average adults.


Three-quarters Say Half of What they Buy for School is Influenced by Children

Fashion-forward teens and tweens know just how to get mom and dad’s attention when it comes to new school gear to make their friends stop and stare. According to the survey, 86.4 percent of school shoppers say their children will influence one-quarter or more of their back-to-school purchases. And for the smaller purchases, children plan to chip in some of their own money; teens will dole out $33.27, and pre-teens will spend an average $17.57.

- See more at: https://nrf.com/media/press-releases/after-splurging-2014-families-trim-back-school-spending-2015#sthash.l4mBg9yf.dpuf

Monday, August 25, 2014

Keep Back-to-School Dirt and Germs Away

DEERFIELD BEACH, Fla.,  -- Starting a new school year means clothes shopping, parent-teacher conferences and kids coming home with sicknesses. Schools, in particular drinking fountains, door handles, cafeteria tables and chairs, and restrooms are ideal environments for germs to live and grow.
In an infographic illustrated by the International Sanitary Supply Association (ISSA), on How Dirty is Your Child's School? nearly 22 million school days are lost annually due to the common cold and 38 million are lost because of influenza.
According to the ISSA, the top five bacteria hotspots children are exposed to at school include:
     1.     Water fountain spigot: 2,700,000 bacteria per inch
     2.     Cafeteria tray: 33,800 bacteria per inch
     3.     Cold water faucet: 32,000 bacteria per inch
     4.     Cafeteria plate: 15,800 bacteria per inch
     5.     Computer keyboard: 3,300 bacteria per inch
"When you have a lot of kids interacting in close environments, illnesses can spread quickly," said Diane Emo, vice president of marketing for Coverall North America, Inc. "Students, parents and teaching staff can take simple steps to provide a united front against the spread of infection."
The ISSA reported that 43.5 percent of school districts don't deliver guidance for infectious disease prevention and cleanliness is usually measured by appearance. Cold and flu viruses can live on surfaces anywhere from a few seconds to 48 hours. Some bacteria can live on surfaces for months, so keep those statistics in mind next time you think that the kitchen counter looks clean enough.
The first step to keeping your child in the classroom and off the couch is teaching them proper hand hygiene. Germs are transmitted by touching a contaminated surface and then touching the eyes, nose or mouth. It's no surprise to hear that children under the age of two put objects in their mouth 81 times an hour and children ages two to five put items in their mouth 42 times per hour.
"Children should learn to wash their hands with plenty of soap, warm water and paper towel or hand dryer. They should be able to sing 'Happy Birthday' or the 'ABCs' twice to remove germs," added Emo.
Teachers and parents can also model good cleaning and hygiene habits to reduce the spread of germs at school; children look to adults as role models and copy their actions. Disinfectant wipes are an affordable tool to use on germ hot spots. Remember that when children go home they will continue to touch anything and everything, only adding to the germ cycle.
Teachers are also thrown into the mix of catching illnesses in the classroom. Teacher absences costs schools more than $25 billion annually and substitute teachers cost the U.S. $4 billion annually. Teachers can also practice good hygiene habits to protect themselves.

Tuesday, August 19, 2014

Local Schools Are Critical to Millennial Home Buyers Realtor.com® Back-to-School Data Shows

SAN JOSE, Calif.-- Millennial buyers are ready to call the suburbs home if that means quality elementary schools. Just in time for the back-to-school season, realtor.com® today reveals the most popular cities and schools viewed using its search-by-school feature, which allows people to explore homes for sale based on specific schools and school districts.
Millennials – people born between 1980 and 2000 – are less likely than other generations to compromise on school districts when searching for a home.  Fifty-two percent of millennials report that school districts are a deal breaker in their home search, compared with 31 percent of all buyers, according to a recent realtor.com® study.
Most of top 10 cities where people research the most school information on realtor.com® are located in affordable, suburban communities outside of larger urban areas. Generally, the suburbs attract younger buyers because of their close proximity to urban job markets and less expensive housing. In June, the top 10 neighborhoods include: 1) Bethel, N.C.; 2) Gadsden, Ala.; 3) Agoura, Calif. (near Los Angeles, Calif.); 4) Kensington, Md. (near Washington D.C.); 5) Greenwood Village, Colo. (near Denver, Colo.); 6)Greenacres, Fla. (near West Palm Beach, Fla.); 7) Watauga, Texas (near Fort Worth, Texas); 8) La Crescent, Minn.; 9) North Hollywood, Calif. (near Los Angeles, Calif.) and 10) Fairburn, Ga. (near Atlanta, Ga.).  
Realtor.com® search-by-school data also reveals that elementary schools are on the minds of those looking for homes. Eight of the top 10 most popular schools viewed on realtor.com® (see chart below) include kindergarten through fifth grade. This indicates that the majority of people who research schools either have young children or expect to start a family when they buy their next home.
"Local schools are clearly more important to specific population segments – such as today's millennials, who either have or are planning to have children. High-ranking schools can have a positive impact on home values over time as new families pay a premium for access to better schools," said Jonathan Smoke, chief economist for realtor.com®, the leader in providing consumers with the most accurate U.S. residential listings online*
The realtor.com® search-by-school feature helps buyers quickly and easily filter accurate local school information so they can decide which homes meet their family's educational needs. Some of its key features include:
  • GreatSchools data displayed for each school including: parent ratings, student to teacher ratio, test scores and a Great Schools ranking
  • An interactive map shows GreatSchools ratings and assignment boundaries for each school in a local area
  • Homes can be searched by public schools or school districts
  • The 'Nearby Schools' button on the realtor.com® mobile app uses a Global Positioning Systems (GPS) to find schools in the home buyers desired neighborhood.
Most Viewed Schools on realtor.com® in June
Rank
School
Location
1
Houston County, Minn.
2
Etowah County, Ala.
3
Sarasota County, Fla.
4
Tarrant County, Texas
5
Chemung County, N.Y.
6
Pitt County, N.C.
7
Osceola County, Fla.
8
Brevard County, Fla.
9
Los Angeles County, Calif.
10
Boone County, Ky.
Cities with the Most School Views on realtor.com® in June


Median Listing Price
% YY
Total Listings
% YY
Median Age of Inventory
% YY
National


$215,000
7.55%
1,893,907
-0.92%
76 days
-5.00%
City
MSA
MSA Search Rank
Median Listing Price
% YY
Total Listings
% YY
Median Age of Inventory
% YY
Bethel, N.C.
Greenville N.C.
N/A*
Gadsden, Ala
Gadsden, Ala
N/A*
Agoura, Calif.
Los Angeles-Long Beach, Calif.
7
$499,000
8.48%
20,013
8.49%
54 days
12.50%
Kensington, Md.
Washington, DC-MD-VA-WV(MD)
41
$325,000
9.24%
10,302
-1.05%
61 days
-12.86%
Greenwood Village, Colo.
Denver, Colo.
21
$352,413
19.46%
6,493
-13.99%
21 days
-22.22%
Greenacres, Fla.
West Palm Beach-Boca Raton, Fla.
13
$269,000
14.47%
15,084
-12.90%
83 days
-23.85%
Watauga, Texas
Fort Worth-Arlington, Texas
11
$196,900
9.39%
7,518
-13.22%
48 days
-7.69%
La Crescent, Minn.
La Crosse, WI-MN(MN)
N/A*
$175,000
2%
124
-14%
105 days
3%
North Hollywood, Calif.
Los Angeles-Long Beach, Calif.
7
$499,000
8.48%
20,013
8.49%
54 days
12.50%
Fairburn, Ga.
Atlanta, Ga.
6
$209,500
13.30%
38,418
-8.96%
69 days
-8.00%