
Showing posts with label Dallas real estate. Show all posts
Showing posts with label Dallas real estate. Show all posts
Friday, October 20, 2017

Thursday, October 6, 2016
Here Are the Best (and Worst) Cities to Own Investment Property
A rise in home prices might be bad news for buyers, but creates big opportunity for investors
For those looking to participate in the often volatile and profitable real estate market, GOBankingRates surveyed 61 out of the 100 most populous cities in the U.S. to find the best and worst cities to own investment property.
GOBankingRates analyzed the following factors:
Stand-Out Study Insights:
Five out of the ten best cities to own property are located in Florida and Texas.
Population levels are actually declining in places like Anchorage and Cleveland, pushing them to the bottom of the list.
When it comes to real estate investments, Midwest isn't best – none of the Midwest states made it into the top 15 of the best states to own investment property.
Seattle, Austin and Reno rank among the top 10 places to own investment property. However, it takes 17 to 19 years to pay off median home values in these cities based on yearly rents.
Methodology: GOBankingRates.com surveyed 61 of the 100 most populous U.S. cities, based on 2015 Census estimates, and evaluated each city by four main factors. (1) employment growth, sourced from the Bureau of Labor Statistics Economic Summaries in August 2016, with the percentage representing the employment change from June 2015 to June 2016 in each city; (2) population growth, based on and sourced from the 2014 and 2015 Census, with the percentage representing the change in population from 2014 to 2015; (3) increase in home values, based on Zillow Home Value, with the percentage representing the change in median home values for single-family homes from June 2015 to June 2016, sourced August 2016; (4) years to pay off property, which was based using the median home value for July 2016 and the median rent for a single family residence for July 2016, both sourced from Zillow; median rent was multiplied by 12 to obtain yearly rent and then home value was divided by yearly rent to determine how many years it would take for the home to be paid off from rental income using current home values and rent prices for each city.
For those looking to participate in the often volatile and profitable real estate market, GOBankingRates surveyed 61 out of the 100 most populous cities in the U.S. to find the best and worst cities to own investment property.
GOBankingRates analyzed the following factors:
- Employment growth: the percent change in the city's number of employed people year-over-year
- Population growth: the percent change in the city's population year-over-year
- Increase in home values: the percent change in the city's median home value year-over-year
- Years to pay off property: the number of years it would take for rental income to pay off the median home value
10 Best Cities to Own Investment Property
|
10 Worst Cities to Own Investment Property
|
1. Orlando, Fla.
|
1. Anchorage, Alaska
|
2. Tampa, Fla.
|
2. Pittsburgh
|
3. Denver
|
3. Chicago
|
4. Seattle
|
4. Virginia Beach, Va.
|
5. Austin, Texas
|
5. Cleveland
|
6. Reno, Nev.
|
6. Honolulu
|
7. Dallas
|
7. Detroit
|
8. Portland, Ore.
|
8. Tulsa, Okla.
|
9. Raleigh, N.C.
|
9. Omaha, Neb.
|
10. Miami
|
10. El Paso, Texas
|
"Growing populations in the top 10 cities on our list are fueling the need for more housing," said Cameron Huddleston, Life + Money columnist for GOBankingRates. "That's why these cities are such great places to own investment property now. On the other hand, the cities at the bottom of our list have seen little-to-no population growth, so the demand for housing isn't as high – which means real estate investors won't do as well there."
Stand-Out Study Insights:
Five out of the ten best cities to own property are located in Florida and Texas.
Population levels are actually declining in places like Anchorage and Cleveland, pushing them to the bottom of the list.
When it comes to real estate investments, Midwest isn't best – none of the Midwest states made it into the top 15 of the best states to own investment property.
Seattle, Austin and Reno rank among the top 10 places to own investment property. However, it takes 17 to 19 years to pay off median home values in these cities based on yearly rents.
Methodology: GOBankingRates.com surveyed 61 of the 100 most populous U.S. cities, based on 2015 Census estimates, and evaluated each city by four main factors. (1) employment growth, sourced from the Bureau of Labor Statistics Economic Summaries in August 2016, with the percentage representing the employment change from June 2015 to June 2016 in each city; (2) population growth, based on and sourced from the 2014 and 2015 Census, with the percentage representing the change in population from 2014 to 2015; (3) increase in home values, based on Zillow Home Value, with the percentage representing the change in median home values for single-family homes from June 2015 to June 2016, sourced August 2016; (4) years to pay off property, which was based using the median home value for July 2016 and the median rent for a single family residence for July 2016, both sourced from Zillow; median rent was multiplied by 12 to obtain yearly rent and then home value was divided by yearly rent to determine how many years it would take for the home to be paid off from rental income using current home values and rent prices for each city.
Thursday, September 22, 2016

Friday, September 16, 2016
Is the Current Pace of Home Sales Sustainable?

There are some experts questioning whether the current pace of residential home sales is sustainable. Are too many people buying homes like in 2004-2006? Are we headed for another housing crisis? Actually, if we look closely at the numbers, we can see that we are looking at a very healthy real estate market.
Why the concern?
Some are looking at the last three years of home sales and comparing them to the three years just prior to the housing bubble. Looking at the graph below, we can understand that thinking.
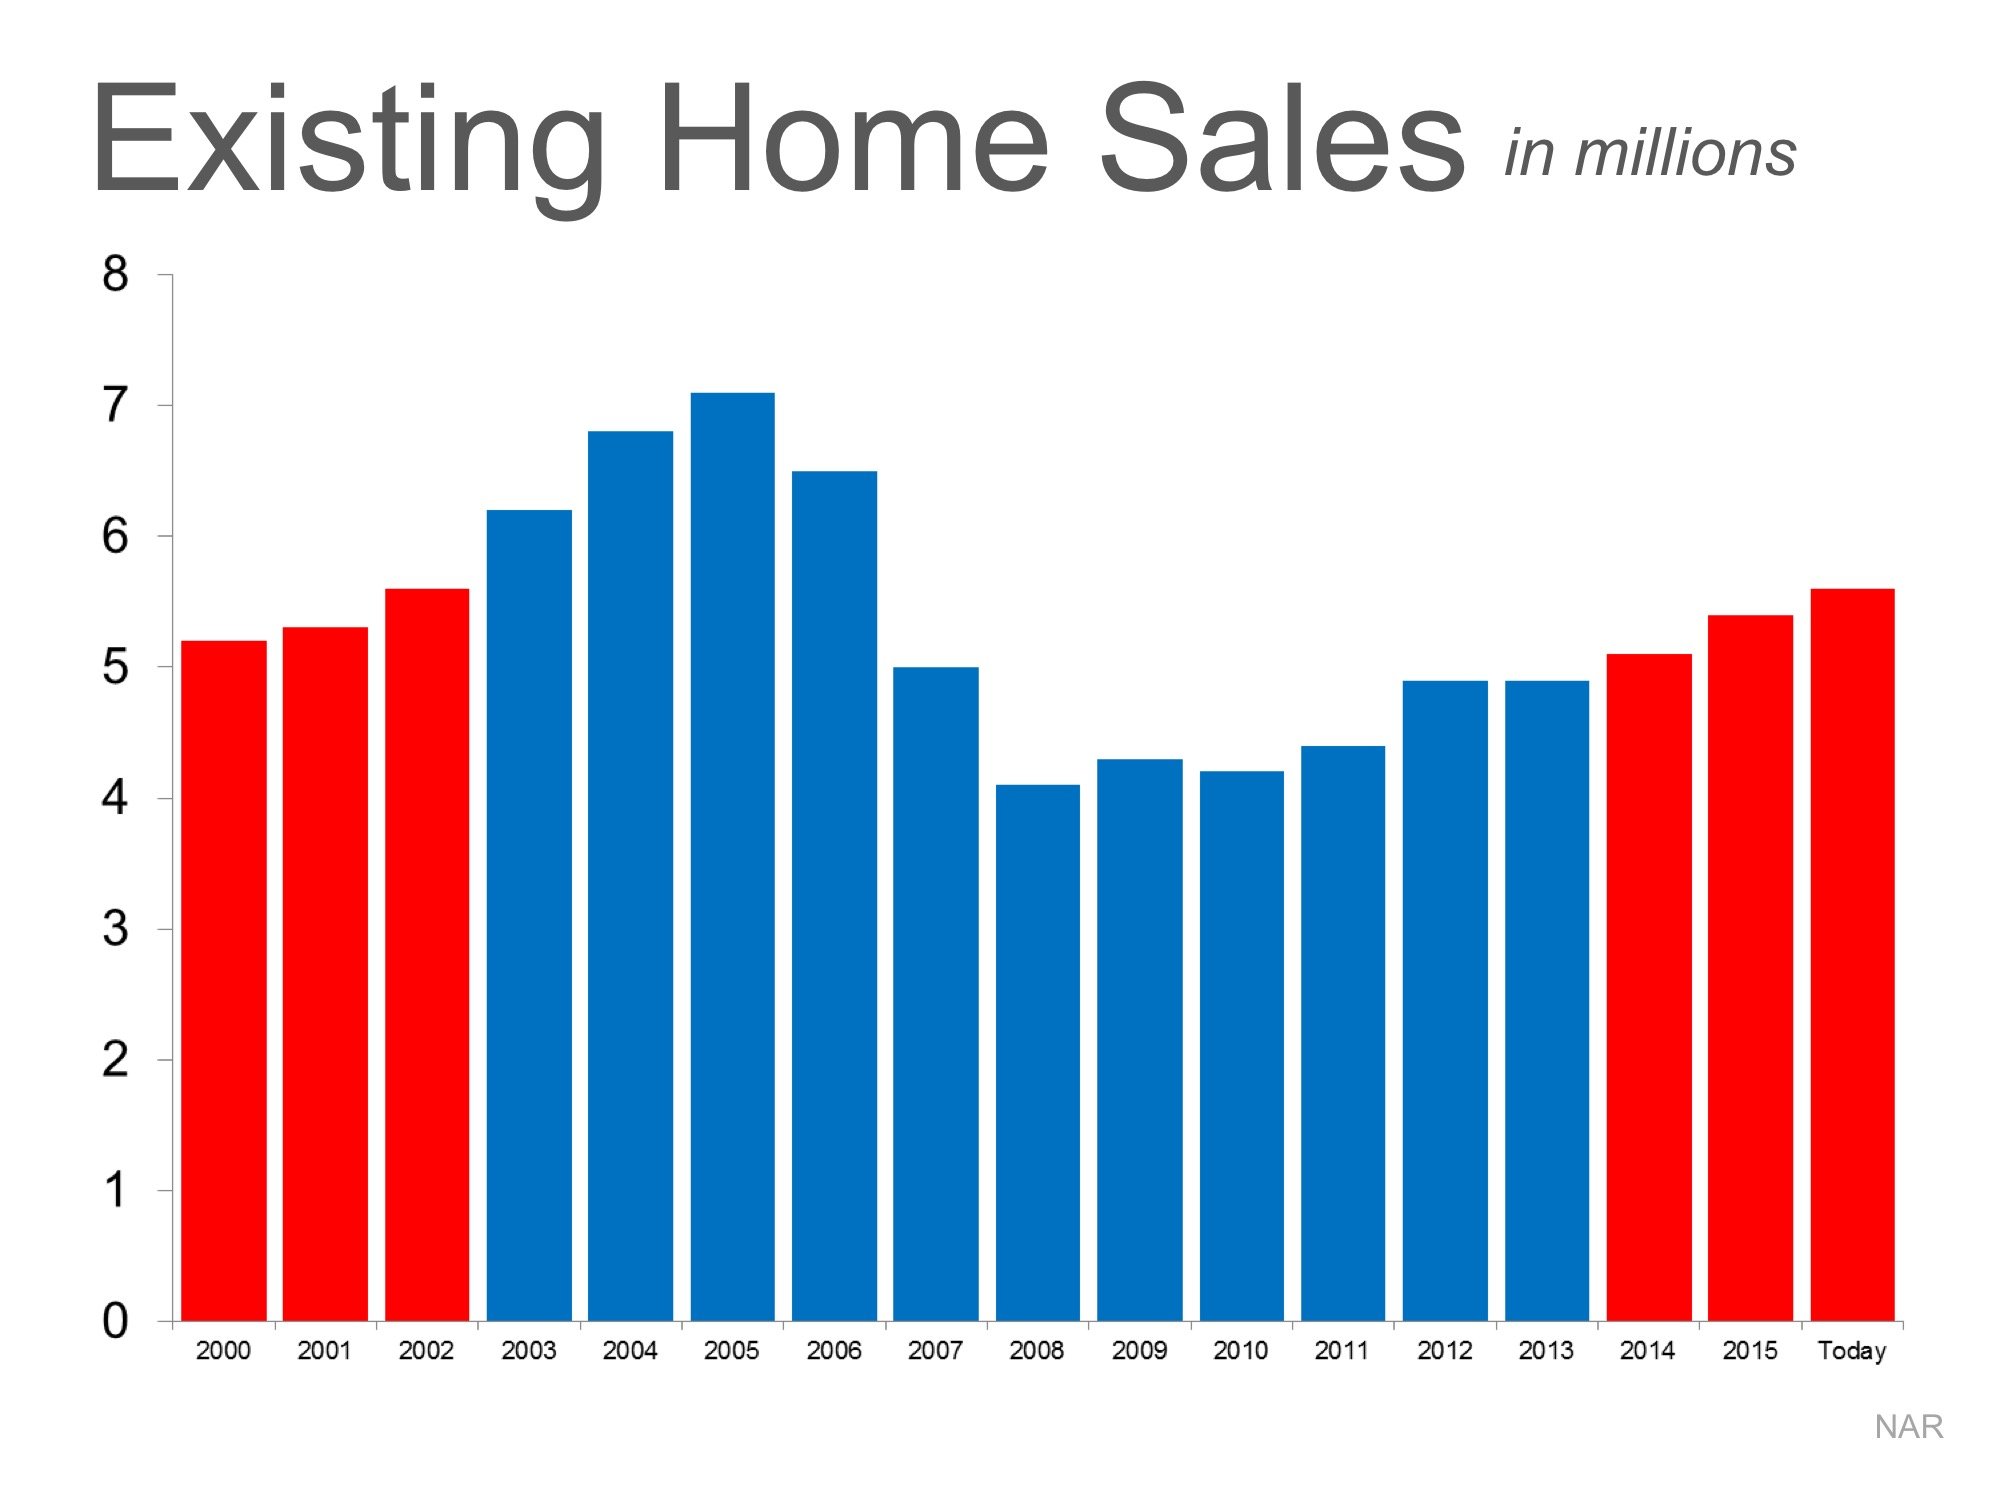
However, if we go further back in history, we can see the real picture. After taking out the “boom & bust” years, the pace of sales is growing at a quite natural pace.
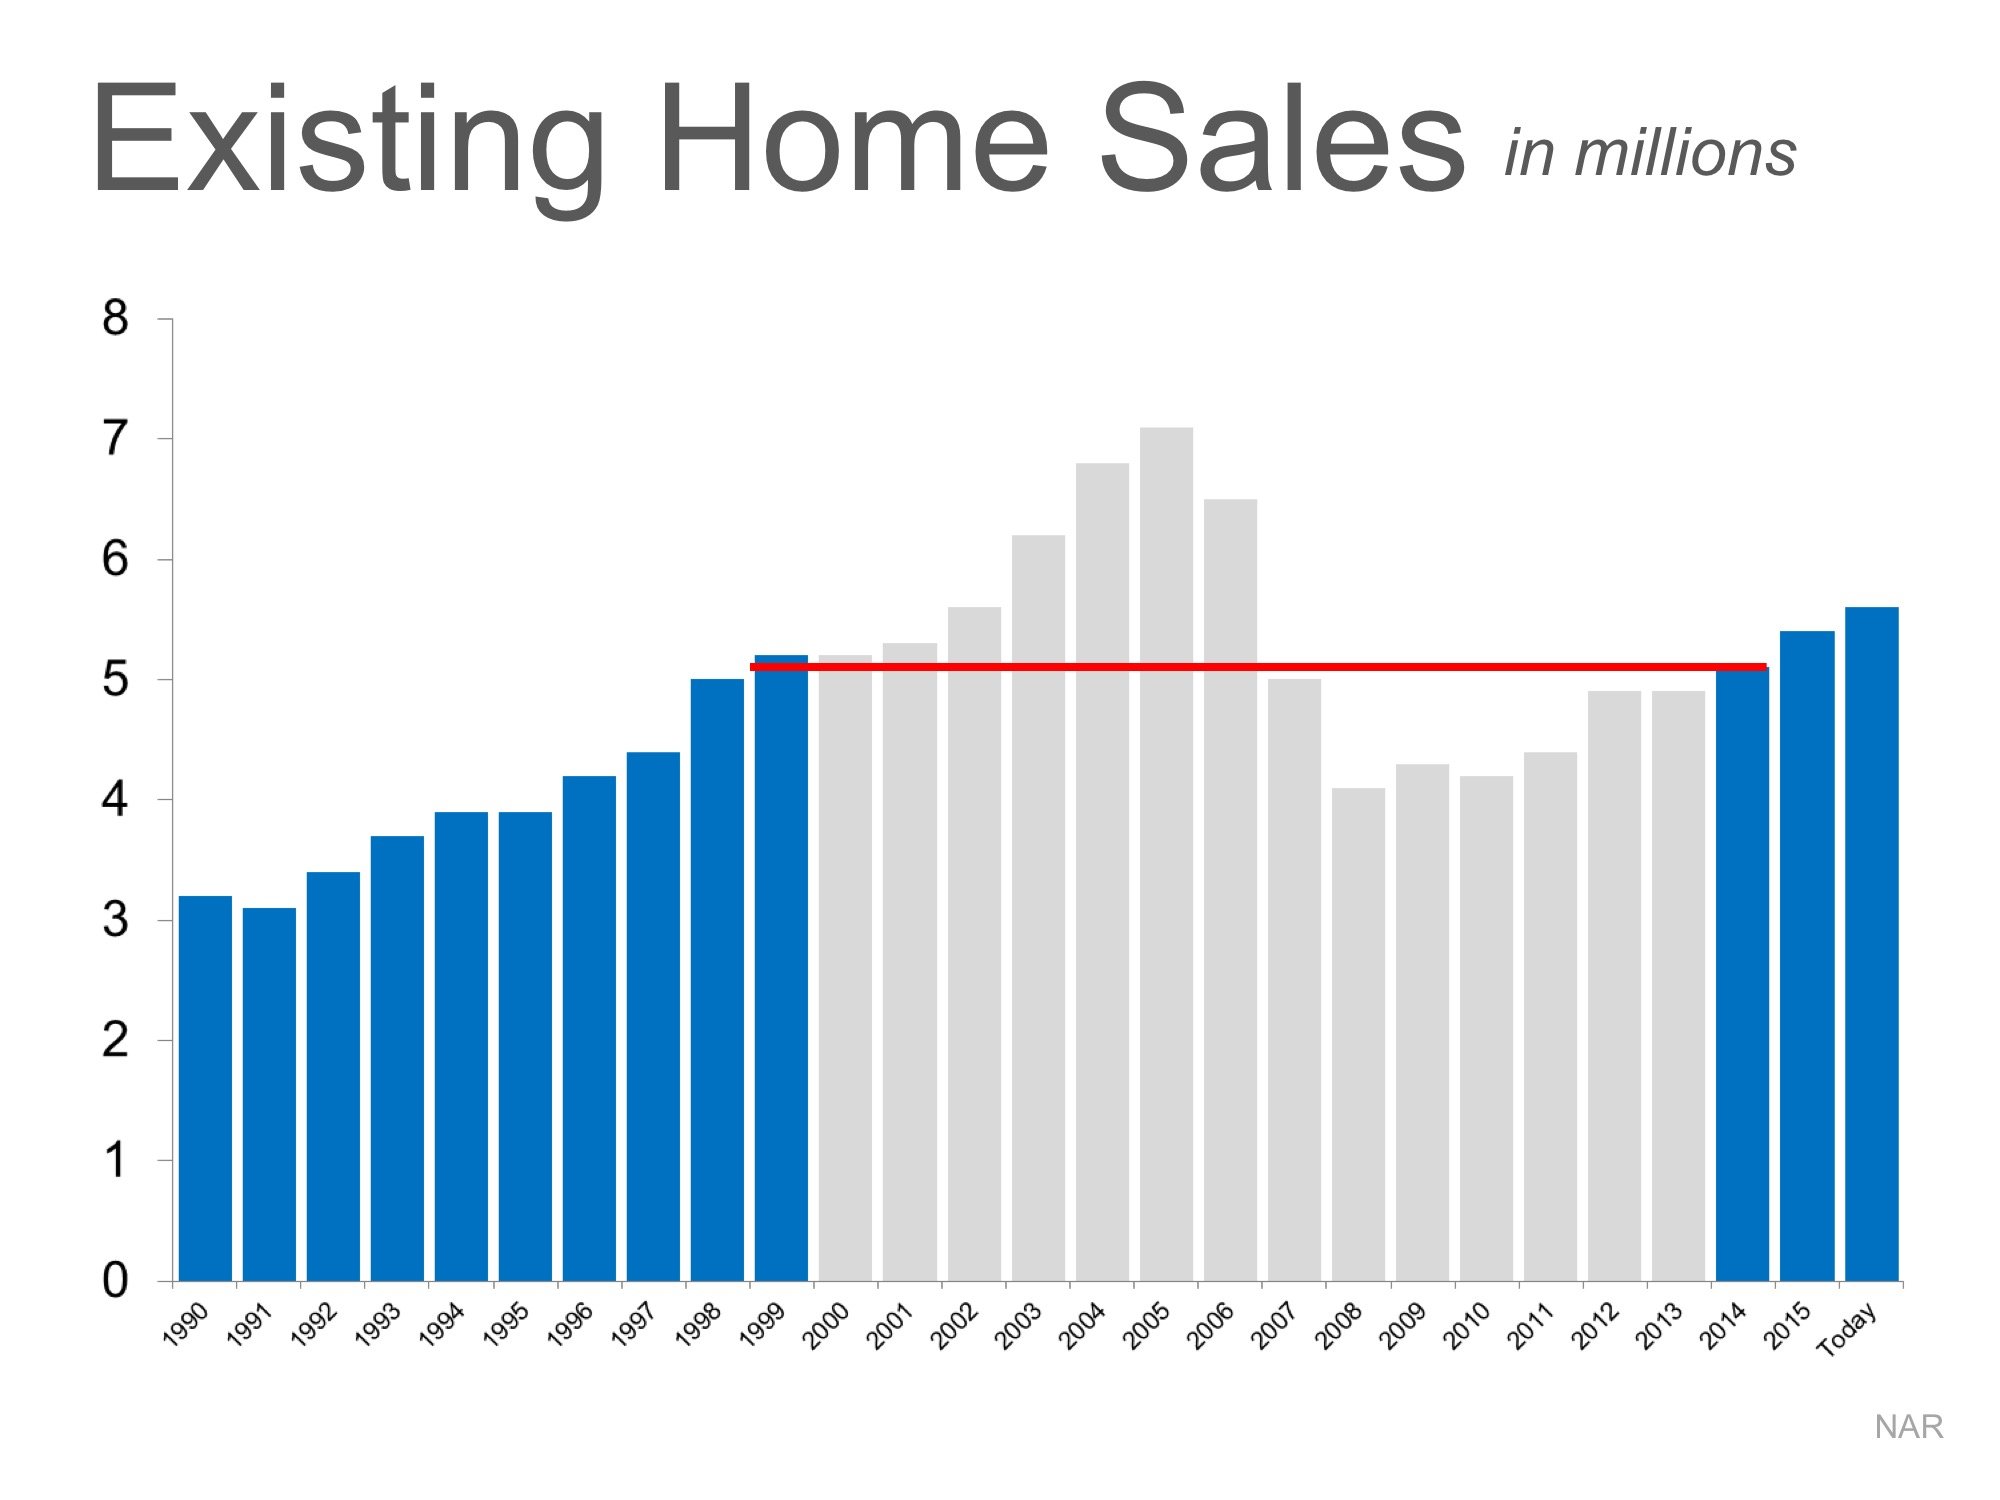
And new home sales are way below historic numbers. Trulia’s Chief Economist Ralph McLaughlin explains:
“Adjusted for population, [new home sales] are at about 63% of their fifty-year average level—way better than 2011, but nowhere near heated.”
Bottom Line
The current pace of residential home sales definitely seems sustainable.
Saturday, July 16, 2016

Friday, June 17, 2016

Thursday, May 12, 2016

Monday, May 2, 2016
Texas home sales jump in first quarter of 2016, inventory drops to all-time low
Texas Association of Realtors releases 2016-Q1 edition of the Texas Quarterly Housing Report
Texas home sales rose significantly in the first quarter of 2016, while housing inventory fell to an all-time low, according to the 2016-Q1 Texas Quarterly Housing Report released today by the Texas Association of Realtors."Despite the economic downturn in some parts of the state, home sales continue to be strong, indicating the enduring demand of Texas real estate," said Leslie Rouda Smith, chairman of the Texas Association of Realtors. "Our state continues to be a hub for relocation activity, business development and job growth."
According to the report, 65,265 homes were sold in Texas in the first quarter of 2016, a 7.8 percent increase from the same quarter of 2015. Home prices continued to rise as well, with the median price for Texas homes increasing 5.4 percent year-over-year to $195,000.
Jim Gaines, Ph.D., economist with the Real Estate Center at Texas A&M University, added, "The Texas economy is experiencing a cooling off period after a five-year boom, so the Texas housing market's strong gains despite the current uneasiness in the state economy are remarkable. It will be interesting to see how Texas real estate activity performs in the next two quarters, typically the strongest quarters for home sales every year. That performance will show the full strength of the Texas housing market in 2016."
Housing inventory fell to an all-time low of 2.8 months in 2016-Q1, a decline of 0.6 months from the first quarter of 2015. The Real Estate Center at Texas A&M University estimates that a monthly housing inventory between 6.0 and 6.5 months is a level at which the supply and demand for homes is balanced.
Active listings also fell sharply in 2016-Q1, dropping 11.9 percent year-over-year to 74,276 active listings. Texas homes also continued to spend less time on the market. In 2016-Q1, Texas homes spent an average of 64 days on the market, a decrease of three days compared to the same quarter of the prior year.
Chairman Smith concluded, "Housing inventory remains extremely limited in Texas. Low housing inventory combined with rising property values is making housing affordability a challenge, not just in Texas's metro areas but across the state. This could become a larger problem if there is not greater balance between supply and demand in the future."
Monday, April 18, 2016
Realtor.com® Identifies America's Boom Towns
New construction, job growth and household formation combine to propel these neighborhoods to America's fastest growing
Realtor.com®, a leading online real estate destination operated by News Corp [NASDAQ: NWS, NWSA]; [ASX: NWS, NWSLV] subsidiary Move, Inc., today released its list of America's Top 'Boom Towns'. Led by Gilbert, Ariz. (85297); Los Angeles (90012), and Dallas (75201), these neighborhoods are striking it rich when it comes to new home construction, job creation and an increasing number of households – the gold mine for housing market growth.
"The strength of the residential real estate market is closely correlated to growth in jobs and households," said Jonathan Smoke, chief economist for realtor.com®. "The good news for these markets is that these growth factors have already started to translate into new construction. At the same time, it may be a year or so before some markets on our list start to see an increase in inventory. If anything, this is a road map for where builders should be thinking about where to break ground next."
America's Top Boom Towns are demonstrating some of the strongest growth in jobs, household formation, and housing starts across the country. Every market on the list has experienced between one and five times the average job growth of the top 100 counties in the country. Household growth in each of these areas is between one and seven times the average growth of the top 100 areas. New home starts are between one and six times the average growth in the top 100 counties. Most importantly, each individual ZIP code is projected to see a growth in households of between nine and 19 percent over the next five years.
Realtor.com®, a leading online real estate destination operated by News Corp [NASDAQ: NWS, NWSA]; [ASX: NWS, NWSLV] subsidiary Move, Inc., today released its list of America's Top 'Boom Towns'. Led by Gilbert, Ariz. (85297); Los Angeles (90012), and Dallas (75201), these neighborhoods are striking it rich when it comes to new home construction, job creation and an increasing number of households – the gold mine for housing market growth.
"The strength of the residential real estate market is closely correlated to growth in jobs and households," said Jonathan Smoke, chief economist for realtor.com®. "The good news for these markets is that these growth factors have already started to translate into new construction. At the same time, it may be a year or so before some markets on our list start to see an increase in inventory. If anything, this is a road map for where builders should be thinking about where to break ground next."
America's Top Boom Towns are demonstrating some of the strongest growth in jobs, household formation, and housing starts across the country. Every market on the list has experienced between one and five times the average job growth of the top 100 counties in the country. Household growth in each of these areas is between one and seven times the average growth of the top 100 areas. New home starts are between one and six times the average growth in the top 100 counties. Most importantly, each individual ZIP code is projected to see a growth in households of between nine and 19 percent over the next five years.
America's Top Boom Towns
| |||||
Ranking
|
ZIP Code
|
ZIP Projected 5 YR HH Growth
|
County HH Growth 2016 vs. Top 100
|
County Starts Growth 2016 vs. Top 100
|
County Job Growth 2016 vs. Top 100
|
1.
|
15.9%
|
7.6X faster
|
5.7X more
|
5.8X more
| |
2.
|
8.8%
|
6.1X faster
|
5.0X more
|
7.2X more
| |
3.
|
14.9%
|
3.0X faster
|
3.8X more
|
4.5X more
| |
4.
|
14.9%
|
3.0X faster
|
3.0X more
|
4.8X more
| |
5.
|
19.4%
|
3.3X faster
|
3.3X more
|
2.5X more
| |
6.
|
11.9%
|
3.1X faster
|
3.1X more
|
2.3X more
| |
7.
|
12.1%
|
1.7X faster
|
2.4X more
|
1.3X more
| |
8.
|
9.2%
|
1.9X faster
|
1.9X more
|
2.0X more
| |
9.
|
18.9%
|
2.5X faster
|
1.4X more
|
4.2X more
| |
10.
|
15.7%
|
1.6X faster
|
2.3X more
|
1.4X more
| |
Methodology: Realtor.com® combined projected measures of job creation, household formation and new construction for 2016 to identify the top growth counties. Based on this information, the top ZIP code for each county was identified based on its five year projected household growth.
|
Thursday, April 14, 2016
Friday, April 8, 2016
Coldwell Banker Previews International Luxury Market Report Reveals Florida & Hot Tech Cities With Emerging High-End Markets Experienced Major Sales Growth In 2015
Report on Top 20 Luxury Real Estate Markets Shows Florida, Atlanta, Seattle & Austin Surge while Bay Area Tech Communities Leveled Off Due to Lack of Inventory

ales of $1 million-plus homes in 2015 surged 32 percent year-over-year in Austin, which is experiencing a boom in tech and entertainment as the home of the Festival; 31 percent in Fort Lauderdale, which benefits directly from its proximity to the perennial luxury hub of Miami; and 30 percent in Seattle, which has achieved gold status as a tech mecca. These increases — some of the largest of any cities in the nation — earn them standout status as entry-level luxury real estate markets as revealed by the new Luxury Market Report released today by the Coldwell Banker Previews International® marketing program.

$5 Million+ Category In the $5 million-plus category of home sales, California cities dominated the Top 10 list, earning five of the top spots, withSouthern California leading with six of the top 10 spots and four of the top five. The exclusive Southern California beachside destination of La Jolla was a clear frontrunner, doubling its sales in this range from 2014 to 2015. Meanwhile, Florida claimed five of the top spots.
$10 Million+ Category Newport Coast, one of the newest California coastal communities to join the $10 million-plus top 20, experienced a massive 175 percent increase in luxury sales more than $10 million. Florida added two newcomers to the list, Wellington and Lake Worth. Outside of New York, Beverly Hills continues to hold the top position for sales more than$10 million. Combining all cities that made the list in Los Angeles County, there were 96 unit sales more than $10 million, an increase of 17 percent in 2015. A stand out for luxury home sellers was the star-studded Pacific Palisades, Calif., commanding a 95 percent ratio of list to sales price.
Overall Luxury Market Summary for 2015 Across all price categories, Florida elevated its coveted position as a top destination for the real estate elite, recording double-digit growth in Miami, Naples and Palm Beach and adding newcomers Lake Worth and Wellington, which placed in the Top 20 list for $10 million sales for the first time.
Tech epicenters in the Bay area posted only modest gains in the number of closed sales as demand outstripped supply in 2015. San Francisco closed 57 percent more units than the previous year at $10 million-plus (11 units in 2015 vs. seven units in 2014) but declined 13 percent in sales of units priced $1 to $5 million, posting a mere 3 percent gain in sales of $5 to $10 million. "Some cities in the Bay area have a 42-day supply of inventory that has left many affluent buyers empty-handed and pushed down potential sales gains," says Mike James, president of Coldwell Banker Residential Brokerage, San Francisco Peninsula and North Bay areas.
The ski markets presented a mixed picture: Aspen made the top six list of luxury home sales both in the $5 million-plus and $10 million-plus categories. Vail recorded a strong showing, but another perennially popular ski destination, Park City, ranked fifth in the nation in both active listings more than $1 million and more than $5 million, yet it did not make the top 20 in either sales category.
Overall, more than 50 percent of the Top 20 cities for luxury home sales across all price categories experienced an increase in activity and more than 40 percent met or exceeded the 90 percent mark of list to sales price. All Top 20 cities with the largest increases in sales of homes more than $1 Million revealed list-to-sales-price ratios of 90 percent or higher, demonstrating robust demand and that sellers are commanding close to asking price in key luxury markets nationwide.
The full Coldwell Banker Previews International list of the Top 20 Best Performing U.S. Cities in Luxury Real Estate by price points of $1 million-plus, $5 million-plus and $10 million-plus, and the high-net-worth consumer survey results can be viewed here: http://www.previewsinsideout.com/2016/04/luxury-market-report-spring-2016
Luxury Market Report MethodologyAll market data has been gathered from the Multiple Listing Service (MLS) databases known or believed to be the primary real estate broker cooperative resources for each market referenced in the report. All closed sales activity reported is for the annual period January 1, 2015 through December 31, 2015. Closed sales reported to the MLSs significantly later than this analysis period will not be included. All active status listing records were downloaded and processed to the same standards, and on various dates, during the months of January and February, 2016. Active status listings added to the MLSs significantly later than download dates will not be included. Property-specific listing and sales records were standardized to USPS address city and ZIP Code, inaccurate list and sale prices were corrected when necessary, and all duplicate records were manually excluded. Average list price and average sales price calculated based on original list price where available. As a result, statistics available via the source data providers may not correlate to this analysis. While all results are believed to be highly accurate, MLS systems do not report all real estate activity in their primary marketplace, and there may have been property transfers not included in this analysis. Copyright © 2016, Real Data Strategies, Inc. All rights reserved. Licensed for the exclusive use of Coldwell Banker Real Estate LLC.
Tuesday, March 22, 2016
Saturday, February 20, 2016

Wednesday, February 10, 2016
Thursday, January 21, 2016
Tuesday, January 12, 2016
Today, Zillow® announced its predictions for the ten hottest housing markets in 2016. Topping the list is Denver, followed by Seattle and Dallas-Fort Worth, all of which are major tech towns – ideal for job growth. Other places that made the list are Utah markets Ogden and Salt Lake City, along with Omaha, Neb. and Boise, Idaho.
To determine which markets would be hot, Zillow looked at home value appreciation, low unemployment rates, and strong income growth. Omaha has the lowest unemployment rate of the ten hottest markets, at just 2.9 percent. Denver saw home values rise 16 percent in 2015, and Zillow is forecasting them to rise another 5 percent in 2016, along with Portland.
A strong and diverse economy is the driving force behind Richmond's high income growth, with government, finance, education, and manufacturing jobs robust in the area and expected to continue in 2016. Boise, Ogden, Salt Lake City and Sacramento all have high forecasted home value appreciation; homes are expected to appreciate an average of about five percent over the next year.
Zillow's Top 10 Housing Markets for 2016:
- Denver, Colo.
- Seattle, Wash.
- Dallas-Fort Worth, Texas
- Richmond, Va.
- Boise, Idaho
- Ogden, Utah
- Salt Lake City, Utah
- Omaha, Neb.
- Sacramento, Calif.
- Portland, Ore.
"Trendy tech centers like San Francisco, Seattle and Denver hogged the spotlight in 2015. But this year, the markets that shine brightest will be those that manage to strike a good balance between strong income growth, low unemployment and solid home value appreciation," said Zillow Chief Economist Dr. Svenja Gudell. "As the job market continues to hum and opportunity becomes more widespread, the best housing markets are no longer limited to the coasts or one-industry tech towns. This year's hottest markets have something for everyone, whether they're looking for somewhere to raise a family or start their career."
Three variables influenced Zillow's hot market predictions: Zillow's Home Value Forecasti, which forecasts the change in the Zillow Home Value Index over the next 12 months, recent income growthii, and current unemployment ratesiii. Those three variables were then scaled and combined to form a 'hotness score,' producing the top ten list.
Subscribe to:
Posts (Atom)