A rise in home prices might be bad news for buyers, but creates big opportunity for investors
For those looking to participate in the often volatile and profitable real estate market, GOBankingRates surveyed 61 out of the 100 most populous cities in the U.S. to find the best and worst cities to own investment property.
GOBankingRates analyzed the following factors:
Employment growth: the percent change in the city's number of employed people year-over-year
Population growth: the percent change in the city's population year-over-year
Increase in home values: the percent change in the city's median home value year-over-year
Years to pay off property: the number of years it would take for rental income to pay off the median home value
10 Best Cities to Own Investment Property
10 Worst Cities to Own Investment Property
1. Orlando, Fla.
1. Anchorage, Alaska
2. Tampa, Fla.
2. Pittsburgh
3. Denver
3. Chicago
4. Seattle
4. Virginia Beach, Va.
5. Austin, Texas
5. Cleveland
6. Reno, Nev.
6. Honolulu
7. Dallas
7. Detroit
8. Portland, Ore.
8. Tulsa, Okla.
9. Raleigh, N.C.
9. Omaha, Neb.
10. Miami
10. El Paso, Texas
"Growing populations in the top 10 cities on our list are fueling the need for more housing," said Cameron Huddleston, Life + Money columnist for GOBankingRates. "That's why these cities are such great places to own investment property now. On the other hand, the cities at the bottom of our list have seen little-to-no population growth, so the demand for housing isn't as high – which means real estate investors won't do as well there."
Stand-Out Study Insights: Five out of the ten best cities to own property are located in Florida and Texas. Population levels are actually declining in places like Anchorage and Cleveland, pushing them to the bottom of the list. When it comes to real estate investments, Midwest isn't best – none of the Midwest states made it into the top 15 of the best states to own investment property. Seattle, Austin and Reno rank among the top 10 places to own investment property. However, it takes 17 to 19 years to pay off median home values in these cities based on yearly rents.
Methodology: GOBankingRates.com surveyed 61 of the 100 most populous U.S. cities, based on 2015 Census estimates, and evaluated each city by four main factors. (1) employment growth, sourced from the Bureau of Labor Statistics Economic Summaries in August 2016, with the percentage representing the employment change from June 2015 to June 2016 in each city; (2) population growth, based on and sourced from the 2014 and 2015 Census, with the percentage representing the change in population from 2014 to 2015; (3) increase in home values, based on Zillow Home Value, with the percentage representing the change in median home values for single-family homes from June 2015 to June 2016, sourced August 2016; (4) years to pay off property, which was based using the median home value for July 2016 and the median rent for a single family residence for July 2016, both sourced from Zillow; median rent was multiplied by 12 to obtain yearly rent and then home value was divided by yearly rent to determine how many years it would take for the home to be paid off from rental income using current home values and rent prices for each city.
Pending home sales in March continued their recent momentum, rising for the third straight month and remaining at their highest level since June 2013, according to the National Association of Realtors®.
The Pending Home Sales Index,* a forward-looking indicator based on contract signings, climbed 1.1 percent to 108.6 in March from an upward revision of 107.4 in February and is now 11.1 percent above March 2014 (97.7). The index has now increased year-over-year for seven consecutive months and is at its highest level since June 2013 (109.4).
Lawrence Yun, NAR chief economist, says contract signings picked up in March as more buyers than usual entered this year's competitive spring market. "Demand appears to be stronger in several parts of the country, especially in metro areas that have seen solid job gains and firmer economic growth over the past year," he said. "While contract activity being up convincingly compared to a year ago is certainly good news, the increased number of traditional buyers who appear to be replacing investors paying in cash is even better news1. It indicates this year's activity is being driven by more long-term homeowners."
Yun expects a gradual improvement in home sales in the months ahead but says insufficient supply and accelerating prices could be a drawback to sales reaching their full potential.
"Demand in many markets is far exceeding supply, and properties in March sold at a faster rate than any month since last summer2," he said. "This in turn has pushed home prices to unhealthy levels – nearly four or more times above the pace of wage growth in some parts of the country. Simply put, housing inventory for new and existing homes needs to improve measurably to improve affordability."
The PHSI in the Northeast fell (1.5 percent) for the fourth straight month to 80.2 in March, but is still 0.6 percent above a year ago. In the Midwest the index declined 2.5 percent to 107.5 in March, but is 11.3 percent above March 2014.
Pending home sales in the South increased 4.0 percent to an index of 126.5 in March and are 12.4 percent above last March. The index in the West rose 1.7 percent in March to 103.7, and is now 15.6 percent above a year ago.
According to NAR's March Realtors® Confidence Index (RCI), sales to investors were 15 percent of sales in the first quarter of 2015, down from 19 percent in the first quarter of 2014. All-cash sales were 26 percent of sales during the first quarter of 2015, down from 33 percent in the first quarter of 2014.
2According to March's RCI, the median days on market was 52 days, the lowest since August 2014 (53 days).
*The Pending Home Sales Index is a leading indicator for the housing sector, based on pending sales of existing homes. A sale is listed as pending when the contract has been signed but the transaction has not closed, though the sale usually is finalized within one or two months of signing.
The index is based on a large national sample, typically representing about 20 percent of transactions for existing-home sales. In developing the model for the index, it was demonstrated that the level of monthly sales-contract activity parallels the level of closed existing-home sales in the following two months.
An index of 100 is equal to the average level of contract activity during 2001, which was the first year to be examined. By coincidence, the volume of existing-home sales in 2001 fell within the range of 5.0 to 5.5 million, which is considered normal for the current U.S. population.
Vacation home sales boomed in 2014 to above their most recent peak level in 2006, while investment purchases fell for the fourth straight year, according to an annual survey of residential homebuyers released today by the National Association of Realtors®.
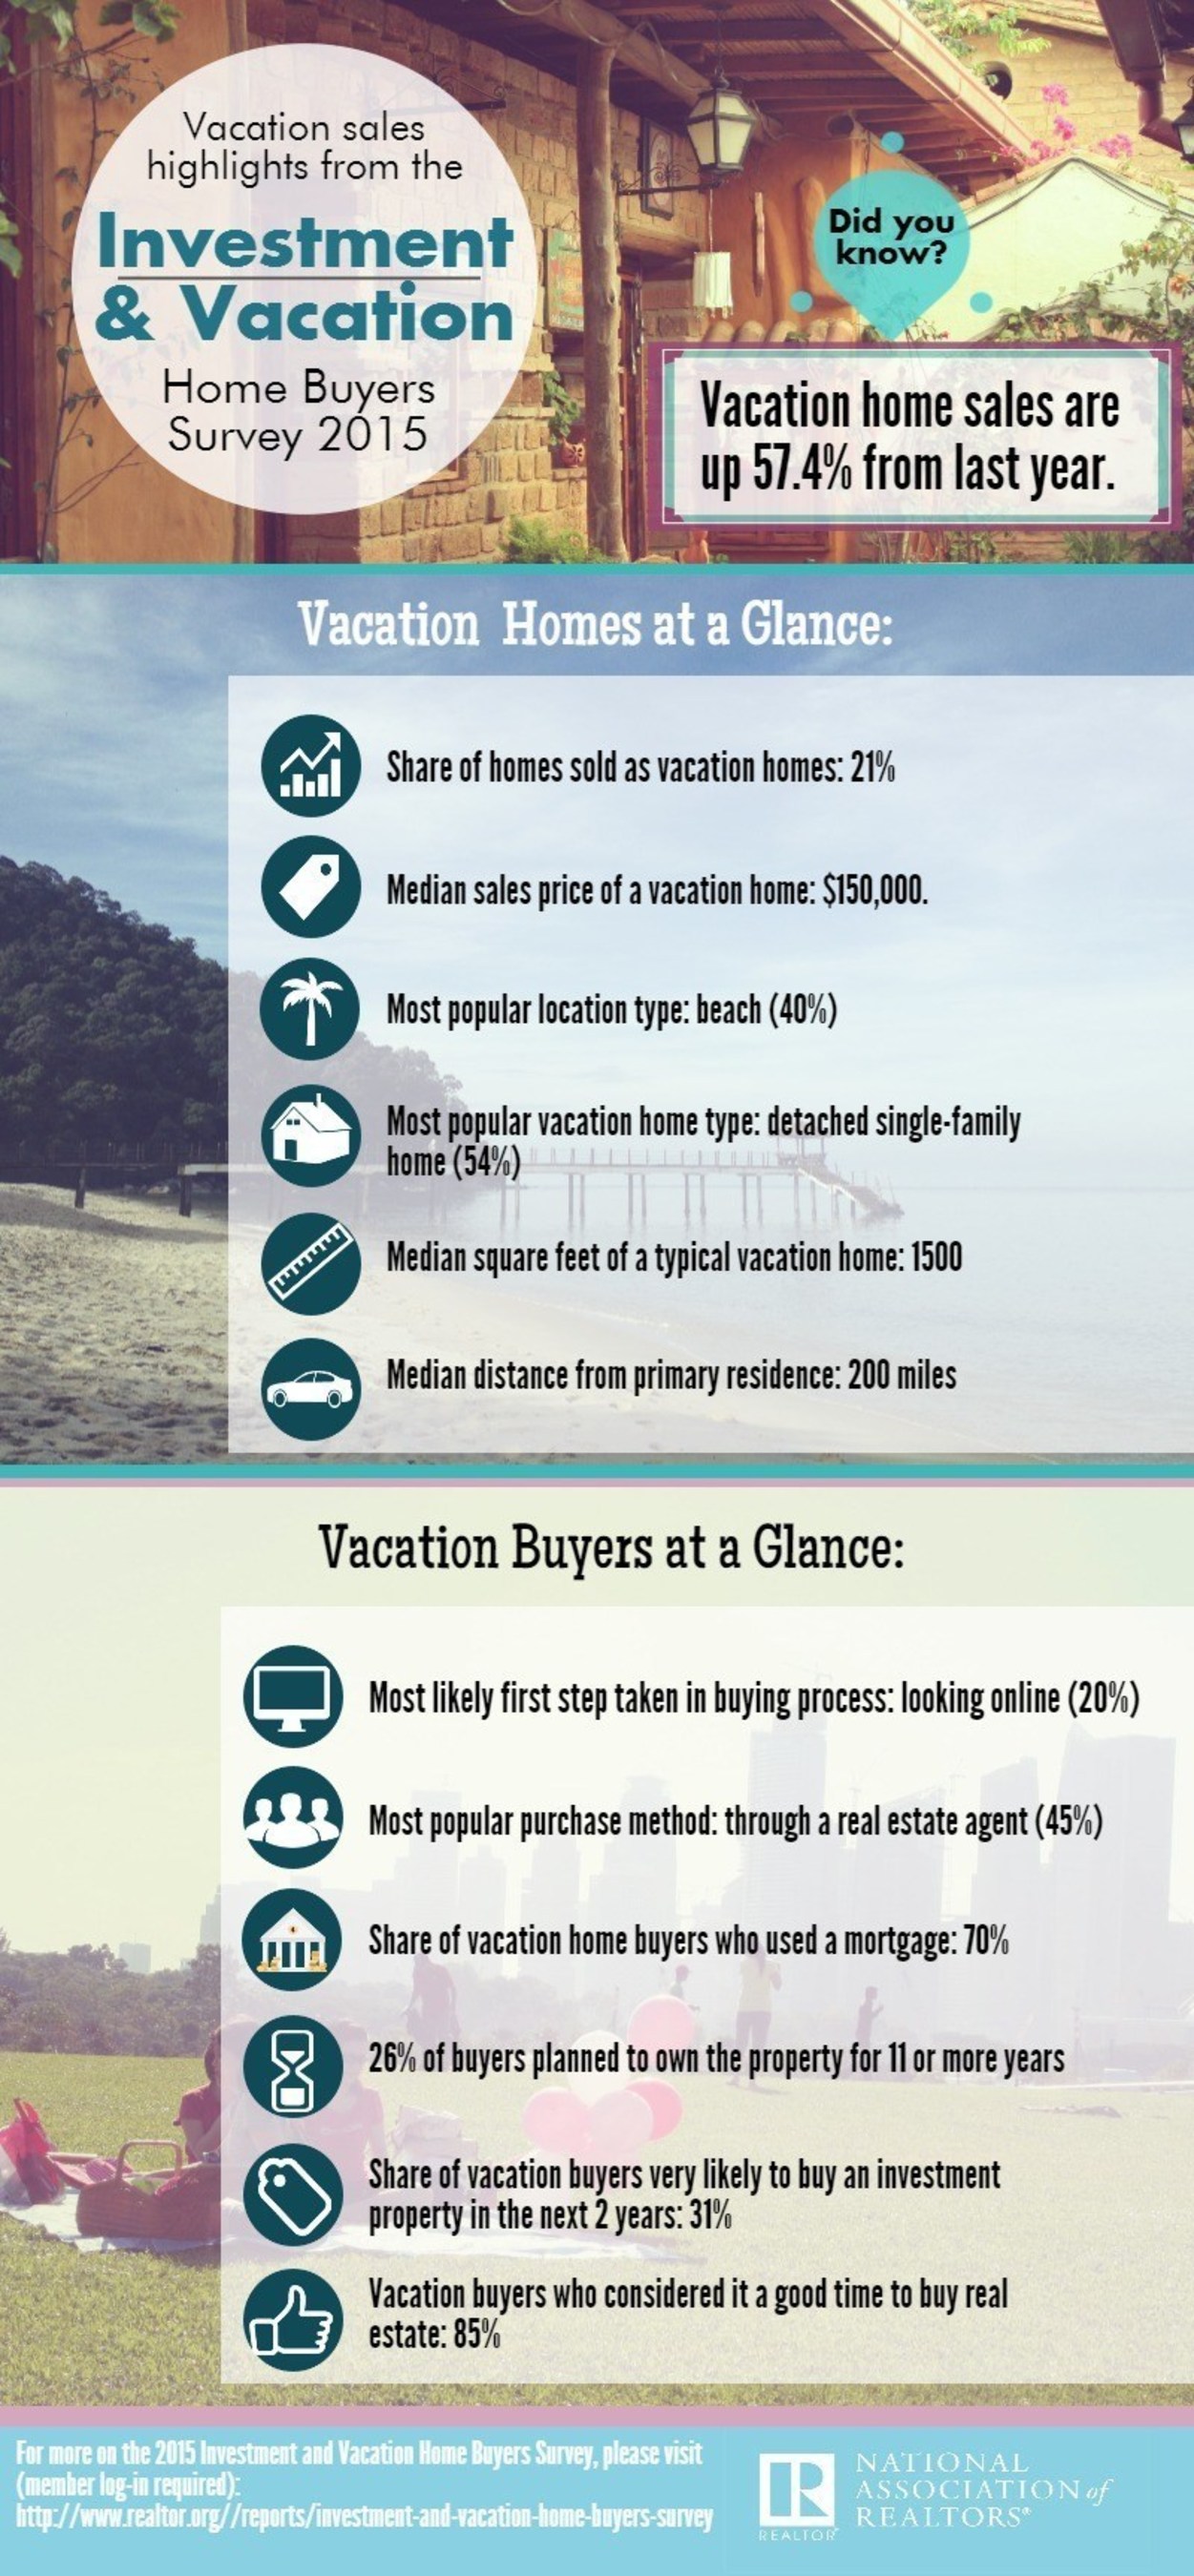
NAR's 2015 Investment and Vacation Home Buyers Survey,* covering existing- and new-home transactions in 2014, shows vacation-home sales catapulted to an estimated 1.13 million last year, the highest amount since NAR began the survey in 2003. Vacation sales were up 57.4 percent from 717,000 in 2013.
Vacation home sales are up 57.4% from last year, according to the National Association of Realtors 2015 Vacation and Investment Home Buyers survey.
Investment-home sales in 2014 decreased 7.4 percent to an estimated 1.02 million in 2014 from 1.10 million in 2013. Owner-occupied purchases fell 12.8 percent to 3.23 million last year from 3.70 million in 2013. The sales estimates are based on responses from nearly 2,000 U.S. adults who purchased a residential property in 2014, and exclude institutional investment activity.
Lawrence Yun, NAR chief economist, says vacation sales in 2014 showed astonishing growth, nearly doubling the combined total of the previous two years. "Affluent households have greatly benefited from strong growth in the stock market in recent years, and the steady rise in home prices has likely given them reassurance that real estate remains an attractive long-term investment," he said. "Furthermore, last year's impressive increase also reflects long-term growth in the numbers of baby boomers moving closer to retirement and buying second homes to convert into their primary home in a few years."
Vacation-home sales accounted for 21 percent of all transactions in 2014, their highest market share since the survey was first conducted. The portion of investment sales fell to 19 percent (20 percent in 2013); owner-occupied purchases declined to 60 percent (67 percent in 2013).
"Despite strong rental demand in many markets, investment property sales have declined four consecutive years to their lowest share since 2010 as rising home prices and fewer distressed properties coming onto the market have further reduced the number of bargains available to turn into profitable rentals," says Yun.
The median sales price of both vacation and investment homes declined in 2014. The median vacation home price was $150,000, down 11.1 percent from $168,700 in 2013. The median investment-home sales price was $125,000, down 3.8 percent from $130,000a year ago.
According to Yun, the decrease in vacation and investment sales prices is likely due to the increase in vacation and investment buyers purchasing condos and townhouses, which contributed to a decline in the median size of 200 square feet for both. Additionally, the rise in vacation buyers purchasing distressed properties and buying in the South, where home prices are often lower, contributed to the overall decline in the sales price of vacation homes.
The share of vacation buyers who paid in cash fell to 30 percent from 38 percent in 2013. Investment buyers who paid in cash decreased to 41 percent from 46 percent a year ago. Of buyers who financed their purchase with a mortgage, nearly half (48 percent) of vacation buyers and 41 percent of investment buyers financed less than 70 percent of the purchase price.
Forty-five percent of vacation homes and 44 percent of investment homes purchased in 2014 were distressed properties – either a home in foreclosure or a short sale. In 2013, 42 percent of vacation homes and 47 percent of investment home purchases were distressed.
Characteristics of Vacation-Home Purchases
The typical vacation-home buyer in 2014 had a higher median household income ($94,380) than those in 2013 ($85,600) and purchased a property that was further away (median distance of 200 miles) than a year ago (180 miles). Buyers plan to own their property for a median of 6 years, unchanged from 2013.
Although a majority (54 percent) of vacation buyers bought a single-family home, the share of those buying a condo (27 percent) or a townhouse or row house (18 percent) increased from a year ago. Forty-percent of vacation buyers purchased in a beach area, 19 percent purchased in the country and 17 percent purchased a vacation home in the mountains.
One-third of vacation buyers plan to use their property for vacations or as a family retreat, 19 percent plan to convert their vacation home into their primary residence in the future, and 13 percent bought for potential price appreciation; the same share purchased because of low real estate prices and because the buyer found a good deal.
Forty-six percent of vacation homes purchased last year were in the South (41 percent in 2013), 25 percent in the West (28 percent in 2013), 15 percent in the Northeast (18 percent in 2013) and 14 percent in the Midwest (unchanged from a year ago).
NAR released a study in late-2014 that identified the top housing markets likely to see a boost in home sales to leading-edge baby boomers1. The findings revealed that metro areas – including many in the South and Southwest – with a lower cost of living and sunnier weather are poised to see an increased number of baby boomers moving in and buying a home in coming years.
Characteristics of Investment-Home Purchases
Investment-home buyers in 2014 had a median household income of $87,680 ($111,400 in 2013) and typically bought a detached single-family home (61 percent) that was a median distance of 24 miles from their primary residence (20 miles in 2013).
Thirty-seven percent of investment buyers last year purchased a property in the South, 26 percent in the West, 20 percent in the Midwest and 17 percent in the Northeast. Investors were most likely (32 percent) to buy in a suburban area, followed by an urban or central city (26 percent), rural area (21 percent) and small town (16 percent). Five percent of investment buyers bought in a resort area.
Investment buyers purchased property for a variety of reasons, including for rental income (37 percent), because of low prices and the buyer found a good deal (17 percent) and for potential price appreciation (15 percent). Overall, investment buyers plan to hold onto the property for a median of five years (unchanged from a year ago), and a majority (68 percent) are very or somewhat likely to buy another investment property in the next two years.
The bulk of investment buyers (86 percent) and vacation buyers (85 percent) reported that now is a good time to purchase real estate.
NAR's 2015 Investment and Vacation Home Buyers Survey, conducted in March 2015, surveyed a sample of adults that had purchased any type of residential real estate during 2014. The survey sample was drawn from a representative panel of U.S. adults monitored and maintained by an established survey research firm. A total of 1,971 qualified adults responded to the survey. Consumers were sampled to meet age and income quotas representative of all home buyers drawn from NAR's 2014 Profile of Home Buyers and Sellers.
The 2015 Investment and Vacation Home Buyers Survey can be ordered by calling 800-874-6500, or online atwww.realtor.org/prodser.nsf/Research. The report is free to NAR members and accredited media and costs $149.95 for non-members.
The National Association of Realtors®, "The Voice for Real Estate," is America's largest trade association, representing 1 million members involved in all aspects of the residential and commercial real estate industries.
*Vacation homes are recreational property purchased primarily for the buyer's (or their family's) personal use, while investment homes are residential property purchased primarily to rent to others, or to hold for other financial or investment purposes.
Home sales were calculated based on a proportion of buyers who bought each respective home type—vacation, investment, and primary residence. The number of purchases for each housing type were calculated using the total number of existing home sales and new homes in 2014. To calculate the difference in the number of purchases in 2013 to 2014, the percent change of each housing type purchased was calculated.
1Baby boomers are generally categorized as those born in the U.S. between 1946 and 1964. NAR's research analyzed leading-edge baby boomers (ages 60-69).
It appears that real estate investment has headed south for the winter, this according to year-end data compiled by Local Market Monitor, the national real estate forecaster, and HomeVestors of America (the "We Buy Ugly Houses"® people) with Texas, North Carolina and Florida ending 2014 as sure bets for single-family investment property markets.
"The real estate markets that made the top 20 list for investing were chosen based on population growth and it's near cousin, job growth - both conditions ideal for investing in single family homes," said Ingo Winzer, president and founder of Local Market Monitor. "In all of the top 20 markets, the populations increased by more than double the national average of one percent."
The top 20 markets for real estate investing are:
Austin-Round Rock, TX
Houston-Baytown-Sugar Land, TX
Raleigh-Cary, NC
Nashville-Davidson-Murfreesboro, TN
Orlando, FL
Boise City-Nampa, ID
San Antonio, TX
Denver-Aurora, CO
Charlotte-Gastonia-Concord, NC
North Port-Bradenton-Sarasota, FL
Oklahoma City, OK
Phoenix-Mesa-Scottsdale, AZ
Seattle-Bellevue-Everett, WA
Dallas-Plano-Irving, TX
Oakland-Fremont-Hayward, CA
Fort Worth-Arlington, TX
Las Vegas-Paradise, NV
Salt Lake City, UT
San Jose-Sunnyvale-Santa Clara, CA
San Francisco-San Mateo-Redwood City, CA
"Texas has always been a sweet spot for real estate investing. Its economy is strong, and only getting stronger. This is spurring population and job growth, especially among younger workers looking for work in retail, business and tourism. They are looking to rent, not buy a home," noted David Hicks, HomeVestors co-president.
Along with job growth and population growth, relatively low home prices is a factor making investments in single-family homes as rental properties a low risk opportunity in some markets. The average home prices in the top 10 markets are under $300,000, although the markets listed among the top 20 range from $166,000 to $844,000.
Despite high home prices, a few California markets made the top 20, including Oakland-Fremont-Hayward (15), San Jose-Sunnyvale-Santa Clara (19) and the San Francisco Bay area (20).
"There is definitely opportunity to strike gold in the California market for real estate investing. With some notable exceptions, they're growing again - both in jobs and in population - as is clear by double-digit home price increases," explained HomeVestors co-president Ken Channel. "But investors in these markets are likely to see more of their gain come from price appreciation and less from a long-term rental stream, because most of these markets are no longer under-priced."
About the Quarterly Data:
The data identifies markets that will be good rental markets and where home prices are likely to increase at a good rate over the next few years. Criteria include markets where:
The population has been growing at above-average rates (4% or better) with growth coming from people moving there in search of jobs;
The current rate of job growth of 2% or better; and
There is low unemployment, so that new jobs will be filled by people who move there, not by unemployed people who are already there.
Markets are excluded that:
Have a small population because they don't have stable economies.
SEATTLE -- Zillow today named the Oklahoma City area the top place where mom-and-pop landlords stand to make the most money on their rental property on a month-to-month basis. A Zillow Rentals analysisi looked at the top 50 U.S metros to determine which areas provide the best short-term return on investment for landlords. Rental property owners in theOklahoma City metro area can expect to profit $536 per month on the median home when comparing anticipated rental income versus their assumed monthly mortgage payment.
Mom-and-pop landlords are homeowners who have turned their personal home into a rental rather than selling it when they move.
Zillow has also named the best places for landlords interested in long-term profitsii. When looking at rental income, tax benefits and accumulated home equity (thanks to rapid home value appreciation), landlords in San Jose, California, make the most money: $8,927per month, or $107,122 per year. The majority of this "profit" is derived from earned but unrealized equity distributed evenly each month over the next six years. Most, if not all, of this profit will not be realized until the landlord sells the property.
"When deciding if they should sell their home or rent it out, most mom-and-pop landlords are primarily concerned with whether or not they can cover their mortgage payment each month – they simply can't absorb monthly losses like professional investors," said Zillow Chief Economist Dr. Stan Humphries. "However, the greatest returns are actually in markets like San Jose and San Francisco where there are short-term monthly losses, but the long-term earned equity makes them the best markets to invest in."
Nationally, the Zillow Rent Index has increased 2.5 percent since June 2013 and 9.1 percent since June 2011. On a local level, the Zillow Rent Index has gone up as much as two to three times that amount over the past year in rental hotspots such as metro Chicago(+6.3 percent) and San Francisco (+11 percent).
Top 10 Markets for Short-term Financial Gain (difference between rent and mortgage payment on the median home, accounting for property and income taxes, maintenance and vacancy)
Top 10 Markets for Long-term Financial Gain (includes home equity gains, tax benefits, and the difference between monthly rental income and mortgage payments after holding onto the property for six years on the median home. Also accounting for property/income taxes, maintenance and vacancy)