Showing posts with label foreclosure. Show all posts

Wednesday, April 15, 2015

CoreLogic Reports February 2015 Completed Foreclosures Down 67 Percent From 2010 Peak

CoreLogic® (NYSE: CLGX), a leading global property information, analytics and data-enabled services provider, today released its February 2015 National Foreclosure Report which shows that the foreclosure inventory declined by 27.3 percent and completed foreclosures declined by 15.7 percent from February 2014. According to CoreLogic data, there were 39,000 completed foreclosures nationwide in February 2015, down from 46,000 in February 2014 and representing a decrease of 67 percent from the peak of completed foreclosures in September 2010.
Completed foreclosures are an indication of the total number of homes actually lost to foreclosure. Since the financial crisis began in September 2008, there have been approximately 5.6 million completed foreclosures across the country, and since homeownership rates peaked in the second quarter of 2004, there have been approximately 7.7 million homes lost to foreclosure.
CoreLogic also reports the number of mortgages in serious delinquency declined by 19.3 percent from February 2014 to February 2015 with 1.5 million mortgages, or 4 percent, in serious delinquency (defined as 90 days or more past due, including those loans in foreclosure or REO). This is the lowest delinquency rate since June 2008. On a month-over-month basis, the number of seriously delinquent mortgages declined by 1.1 percent.
As of February 2015 the national foreclosure inventory included approximately 553,000 homes compared to 761,000 homes in February 2014. The foreclosure inventory as of February 2015 represented 1.4 percent of all homes with a mortgage, compared to 1.9 percent in February 2014.
“The number of homes in foreclosure proceedings fell by 27 percent from a year ago and stands at about one-third of what it was at the trough of the housing cycle,” said Frank Nothaft, chief economist at CoreLogic. “While the drop in the share of mortgages in foreclosure to 1.4 percent is a welcome sign of continued recovery in the housing market, the share remains more than double the 0.6 percent average foreclosure rate that we saw during 2000-2004.”
“The foreclosure inventory dropped year-over-year in all but two states,” said Anand Nallathambi, president and CEO of CoreLogic. “The foreclosure rates in judicial foreclosure states are beginning to pick up and remain higher than in non-judicial states. What’s encouraging is that fewer Americans are seriously delinquent in paying their mortgages which in turn is reducing the foreclosure inventory across the country as a whole.”
Additional highlights as of February 2015:
  • On a month-over-month basis, completed foreclosures were down 11.6 percent from the 44,000* reported in January 2015. As a basis of comparison, before the decline in the housing market in 2007, completed foreclosures averaged 21,000 per month nationwide between 2000 and 2006.
  • The five states with the highest number of completed foreclosures for the 12 months ending in February 2015 were: Florida (110,000), Michigan (50,000), Texas (34,000), California (30,000) and Georgia (28,000). These five states accounted for almost half of all completed foreclosures nationally.
  • Four states and the District of Columbia had the lowest number of completed foreclosures for the 12 months ending in February 2015: South Dakota (15), the District of Columbia (83), North Dakota (334), West Virginia (506) and Wyoming (526).
  • On a month-over-month basis, the foreclosure inventory was down by 1.4 percent from January 2015. The February 2015 foreclosure rate of 1.4 percent is back to March 2008 levels.
  • Four states and the District of Columbia had the highest foreclosure inventory as a percentage of all mortgaged homes: New Jersey (5.3 percent), New York (4.0 percent), Florida (3.4 percent), Hawaii (2.8 percent) and the District of Columbia (2.6 percent).
  • The five states with the lowest foreclosure inventory as a percentage of all mortgaged homes were: Alaska (0.3 percent), Nebraska (0.4 percent), North Dakota (0.5 percent), Montana (0.5 percent) and Minnesota (0.5 percent).

Tuesday, July 1, 2014

NeighborWorks America Urges Homeowners to Avoid Paying for Loan Modifications

WASHINGTON  -- Like many homeowners, Sixto Diaz was current on his mortgage when he decided to get a loan modification. His monthly payment was increasing and the mortgage was upside down so he reached out to aCalifornia company for help. They promised he would get a loan modification if he paid them $3,000. They guaranteed results so he paid the money and hoped for the best. One year passed with no results. Then he realized he had lost his money to scammers. Fortunately, he is working with a HUD-approved counseling agency free of charge to get a loan modification.
NeighborWorks America urges homeowners to avoid paying for a loan modification or to stop a foreclosure. They released a video featuring everyday people that illustrates how homeowners, like Sixto Diaz, are willing to pay thousands of dollars if they think it will save their home. Free help is available from their lender or a HUD-approved counseling agency. Yet scam artists often ask homeowners for a payment or administrative "fees," usually upfront. The Federal Trade Commission issued the Mortgage Assistance Relief Services (MARS) rule which made it illegal for companies to request money upfront. But when mortgage problems arise, many homeowners are lured by the promise of help.
"Homeowners could be vulnerable to a scam if they seek a loan modification from a third party, whether their mortgage is current or delinquent. Loan scam artists are relentless. We tell consumers that being asked for a payment, especially upfront, is the #1 sign of a scam," says Barbara Floyd Jones, senior manager of National Homeownership Programs at NeighborWorks America. "Consumers in the video were willing to pay thousands to get help, which shows just how far homeowners will go to save their homes. We want homeowners to learn the signs of a scam and report the scam artists so they can protect themselves, friends and family when seeking a loan modification or a solution to foreclosure."
Loan modification scams can be difficult to spot but the top signs include:
  1. A company/person asks for a fee in advance to work with your lender to modify, refinance or reinstate your mortgage.
  2. A company/person guarantees they can stop a foreclosure or get your loan modified.
  3. A company/person advises you to stop paying your mortgage company and pay them instead.
Homeowners are encouraged to seek free assistance from a HUD-approved counseling agency. "In addition to helping homeowners seek a modification or stop foreclosure, housing counselors can determine if they may qualify for mortgage assistance programs or other types of assistance. They can refer homeowners to free or low-cost legal assistance if needed," said Floyd Jones.  
To find a local HUD-approved counseling agency, speak to a housing counselor 24 hours a day or report a scam, call 888-995-HOPE (4673). Or visit LoanScamAlert.org to learn more.

Monday, June 2, 2014

CoreLogic Reports 46,000 Completed Foreclosures in April

Foreclosure inventory down 35 percent nationally from a year ago

 — CoreLogic® (NYSE: CLGX), a leading global property information, analytics and data-enabled services provider, today released its April National Foreclosure Report, which provides data on completed U.S. foreclosures and foreclosure inventory. According to CoreLogic, for the month of April 2014, there were 46,000 completed foreclosures nationally, down from 56,000 in April 2013, a year-over-year decrease of 18 percent. On a month-over-month basis, completed foreclosures were down slightly, by 0.4 percent, from the 47,000* reported in March 2014. As a basis of comparison, before the decline in the housing market in 2007, completed foreclosures averaged 21,000 per month nationwide between 2000 and 2006.
Completed foreclosures are an indication of the total number of homes actually lost to foreclosure. Since the financial crisis began in September 2008, there have been approximately 5 million completed foreclosures across the country.
As of April 2014, approximately 694,000 homes in the United States were in some stage of foreclosure, known as the foreclosure inventory, compared to 1.1 million in April 2013, a year-over-year decrease of 35 percent. The foreclosure inventory as of April represented 1.8 percent of all homes with a mortgage, compared to 2.7 percent in April 2013. The foreclosure inventory was down 4.7 percent from March 2014, representing the 30th month of year-over-year declines.
“Over the last 12 months, completed foreclosures fell to 599,000, the lowest level since the Great Recession began in 2007,” said Sam Khater, deputy chief economist for CoreLogic. “At the current pace of completed foreclosures, and given the current foreclosure inventory, it will take 14 months to move all of the foreclosed inventory through the pipeline.”
“We have now registered two and a half years of continuous decreases in the number of homeowners who are in some stage of the foreclosure process. This consistent decline means fewer Americans are experiencing the distress of delinquency and default,” said Anand Nallathambi, president and CEO of CoreLogic. “The recovery may be slow, but it is steady.”
Highlights as of April 2014:
  • Every state, excluding New York and the District of Columbia, posted double-digit year-over-year declines in foreclosures.
  • Thirty-seven states show declines in year-over-year foreclosure inventory of greater than 30 percent with Arizona, Utah, Minnesota and California and experiencing declines greater than 50 percent.
  • The five states with the highest number of completed foreclosures for the 12 months ending in April 2014 were: Florida (121,000), Michigan (46,000), Texas (38,000), California (33,000) and Georgia (32,000).These five states account for almost half of all completed foreclosures nationally.
  • The five states (including the District of Columbia) with the lowest number of completed foreclosures for the 12 months ending in April 2014 were: the District of Columbia (68), North Dakota (352), West Virginia (517), Wyoming (718) and Alaska (844).
  • The five states with the highest foreclosure inventory as a percentage of all mortgaged homes were: New Jersey (6.0 percent), Florida (5.4 percent), New York (4.6 percent), Hawaii (3.1 percent) and Maine (3.0 percent).
  • The five states with the lowest foreclosure inventory as a percentage of all mortgaged homes were: Alaska (0.4 percent), Wyoming (0.4 percent), North Dakota (0.5 percent), Nebraska (0.5 percent) and Minnesota (0.5 percent).
Thursday, April 3, 2014

CoreLogic Reports U.S. Foreclosure Inventory Down 35 Percent Nationally From a Year Ago

Value of Shadow Inventory Down $70 Billion From One Year Ago

— CoreLogic® (NYSE: CLGX), a leading global property information, analytics and data-enabled services provider, today released its February 2014 National Foreclosure Report with a supplement featuring quarterly shadow inventory data as of January 2014.
According to the CoreLogic analysis:
  • There were 43,000 completed foreclosures in the United States in February 2014, down from 51,000 in February 2013, a year-over-year decrease of 15 percent. On a month-over-month basis, completed foreclosures decreased 13.1 percent from 50,000 in January 2014.*
  • National residential shadow inventory was 1.7 million homes as of January 2014 compared to 2.2 million in January 2013, a year-over-year decrease of 23 percent.
Completed foreclosures are an indication of the total number of homes actually lost to foreclosure. Since the financial crisis began in September 2008, there have been approximately 4.9 million completed foreclosures across the country.
As of February 2014, approximately 752,000 homes in the United States were in some stage of foreclosure, known as the foreclosure inventory, compared to 1.2 million in February 2013, a year-over-year decrease of 35 percent. Month over month, the foreclosure inventory was down 3.3 percent from January 2014. The foreclosure inventory as of February represented 1.9 percent of all homes with a mortgage, compared to 2.9 percent in February 2013.
At the end of February 2014, there were 1.9 million mortgages, or 4.9 percent, in serious delinquency, defined as 90 days or more past due, including those loans in foreclosure or real estate owned (REO).
“Although there is good news that completed foreclosures are trending lower, the bigger news is the impressive decline in the foreclosure and shadow inventories,” said Dr. Mark Fleming, chief economist for CoreLogic. “Every state has had double-digit, year-over-year declines in foreclosure inventory, which is reflected in the $70 billion decline in the shadow inventory.”
“The stock of seriously delinquent homes and the foreclosure rate are back to levels last seen in the final quarter of 2008,” said Anand Nallathambi, president and CEO of CoreLogic. “The shadow inventory has also declined year over year for the past 3 years as the housing market continues to heal, including double-digit declines for the past 16 consecutive months.”
Foreclosure Highlights:
  • The five states with the highest number of completed foreclosures for the 12 months ending February 2014 were Florida (118,000), Michigan (50,000), Texas (39,000), California (37,000) and Georgia (34,000).These five states accounted for almost half of all completed foreclosures nationally
  • Four states and the District of Columbia experienced the lowest number of completed foreclosures for the 12 months ending February 2014: The District of Columbia (60), North Dakota (421), Hawaii (519), West Virginia (571) and Wyoming (705).
  • The five states with the highest foreclosure inventory as a percentage of all mortgaged homes as of February 2014 were New Jersey (6.2 percent), Florida (6.0 percent), New York (4.7 percent), Maine (3.4 percent) and Connecticut (3.2 percent).
  • The five states with the lowest foreclosure inventory as a percentage of all mortgaged homes as of February 2014 were Wyoming (0.3 percent), Alaska (0.4 percent), North Dakota (0.5 percent), Nebraska (0.5 percent) and Colorado (0.6 percent).
Shadow Inventory Highlights:
  • The value of shadow inventory was $254 billion as of January 2014, down from $324 billion a year ago and down from $289 billion six months ago.
  • As of January 2014, year-over-year inventory of seriously delinquent homes decreased in all states by double digits. Twenty-four states experienced year-over-year declines in serious delinquency by at least 20 percent.
  • The shadow inventory is down 22 percent compared to January 2013.
  • Over the 12 months ending January 2014, shadow inventory has been decreasing at an average monthly rate of 41,000 units.
  • As of January 2014, Florida, California, New York, New Jersey and Illinois carried 42 percent of all distressed properties in the country. Florida continues to account for 15 percent of the nation’s distressed properties.
CoreLogic estimates the current stock of properties in the shadow inventory, also known as pending supply, by calculating the number of properties that are seriously delinquent, in foreclosure or held as REO by mortgage servicers but not currently listed on multiple listing services (MLSs). Transition rates of “delinquency to foreclosure” and “foreclosure to REO” are used to identify the currently distressed, unlisted properties most likely to become REO properties. Properties that are not yet delinquent, but may become delinquent in the future, are not included in the estimate of the current shadow inventory. Shadow inventory is typically not included in the official reporting measurements of unsold inventory.

Saturday, March 8, 2014

CORELOGIC REPORTS 4 MILLION RESIDENTIAL PROPERTIES RETURNED TO POSITIVE EQUITY IN 2013

About 6.5 Million Residential Properties with a Mortgage Still in Negative Equity

 — CoreLogic® (NYSE: CLGX), a leading residential property information, analytics and services provider, today released new analysis showing 4 million homes returned to positive equity in 2013, bringing the total number of mortgaged residential properties with equity to 42.7 million. The CoreLogic analysis indicates that nearly 6.5 million homes, or 13.3 percent of all residential properties with a mortgage, were still in negative equity at the end of 2013. Due to a small slowdown in the quarterly growth rate of the Home Price Index, the negative equity share was virtually unchanged from the third quarter of 2013.*
Negative equity, often referred to as “underwater” or “upside down,” means that borrowers owe more on their mortgages than their homes are worth. Negative equity can occur because of a decline in value, an increase in mortgage debt or a combination of both.
For the homes in negative equity status, the national aggregate value of negative equity was $398.4 billion for fourth quarter 2013, compared to $401.3 billion for third quarter 2013, a decrease of $2.9 billion.
Of the 42.7 million residential properties with positive equity, 10 million have less than 20-percent equity. Borrowers with less than 20-percent equity, referred to as “under-equitied,” may have a more difficult time obtaining new financing for their homes due to underwriting constraints. Under-equitied mortgages accounted for 21.1 percent of all residential properties with a mortgage nationwide in 2013, with more than 1.6 million residential properties at less than 5-percent equity, referred to as near-negative equity. Properties that are near-negative equity are considered at risk if home prices fall.
“The plight of the underwater borrower has improved dramatically since negative equity peaked in December 2009 when more than 12 million mortgaged homeowners were underwater,” said Mark Fleming, chief economist for CoreLogic. “Over the past four years, more than 5.5 million homeowners have regained equity, reducing their risk of foreclosure and unlocking pent-up supply in the housing market.”
“Stability and growth in the housing market are essential for a durable recovery of the U.S. economy,” said Anand Nallathambi, president and CEO of CoreLogic. “The rebound in home prices in 2013 helped 4 million property owners regain at least some positive equity in their largest asset—their home. We still have a long way to go to eliminate the negative equity overhang but significant progress is being made every day across most of the country.”
Highlights as of Q4 2013:
  • Nevada had the highest percentage of mortgaged properties in negative equity at 30.4 percent, followed by Florida (28.1 percent), Arizona (21.5 percent), Ohio (19.0 percent) and Illinois (18.7 percent). These top five states combined account for 36.9 percent of negative equity in the United States.
  • Of the 25 largest Core Based Statistical Areas (CBSAs) based on population, Orlando-Kissimmee-Sanford, Fla., had the highest percentage of mortgaged properties in negative equity at 31.5 percent, followed by Tampa-St. Petersburg-Clearwater, Fla. (30.4 percent), Phoenix-Mesa-Scottsdale, Ariz. (22.1 percent), Chicago-Naperville-Arlington Heights, Ill. (21.4 percent) and Atlanta-Sandy Springs-Roswell, Ga. (19.9 percent).
  • Of the total $398 billion in negative equity, first liens without home equity loans accounted for $205 billion aggregate negative equity, while first liens with home equity loans accounted for $193 billion.
  • Approximately 3.9 million upside-down borrowers hold first liens without home equity loans. The average mortgage balance for this group of borrowers is $219,000. The average underwater amount is $52,000.
  • Approximately 2.6 million upside-down borrowers hold both first and second liens. The average mortgage balance for this group of borrowers is $293,000.The average underwater amount is $75,000.
  • The bulk of home equity for mortgaged properties is concentrated at the high end of the housing market. For example, 92 percent of homes valued at greater than $200,000 have equity compared with 81 percent of homes valued at less than $200,000.

Wednesday, May 1, 2013

CoreLogic Reports 55,000 Completed Foreclosures in March


—Foreclosure Inventory Down 23 Percent Nationally Since March 2012—

IRVINE, Calif., CoreLogic® (NYSE: CLGX), a leading residential property information, analytics and services provider, today released its March National Foreclosure Report which provides data on completed U.S. foreclosures and the national foreclosure inventory. According to CoreLogic, there were 55,000 completed foreclosures in the U.S. in March 2013, down from 66,000 in March 2012, a year-over-year decrease of 16 percent. On a month-over-month basis, completed foreclosures rose from 52,000* in February 2013 to the March level of 55,000, an increase of 6 percent.

As a basis of comparison, prior to the decline in the housing market in 2007, completed foreclosures averaged 21,000 per month nationwide between 2000 and 2006. Completed foreclosures are an indication of the total number of homes actually lost to foreclosure. Since the financial crisis began in September 2008, there have been approximately 4.2 million completed foreclosures across the country.

Approximately 1.1 million homes in the U.S. were in some stage of foreclosure, known as the foreclosure inventory, as of March 2013 compared to 1.5 million in March 2012, a year-over-year decrease of 23 percent. Month over month, the foreclosure inventory was down 1.9 percent from February 2013 to March 2013. The foreclosure inventory as of March 2013 represented 2.8 percent of all homes with a mortgage compared to 3.5 percent in February 2013.

“In March, completed foreclosures were down 52 percent from the peak in 2010, and almost all of the top 100 major metropolitan areas have declining foreclosure rates,” said Dr. Mark Fleming, chief economist for CoreLogic. “The foreclosure rate nationally is down 23 percent relative to a year ago, signaling continued reduction in the stock of distressed assets.”

“For 17 consecutive months, foreclosures have declined year over year across the U.S,” said Anand Nallathambi, president and CEO of CoreLogic. “Although we still have more than a million homes in some stage of foreclosure, this trend, combined with rising home prices, is a another signal of a gradually improving housing market.”

Highlights as of March 2013:

  • The five states with the highest number of completed foreclosures for the 12 months ending in March 2013 were: Florida (103,000), California (83,000), Michigan (70,000), Texas (53,000) and Georgia (48,000). These five states account for almost half of all completed foreclosures nationally.
  • The five states with the lowest number of completed foreclosures for the 12 months ending in March 2013 were: South Dakota (81), District of Columbia (101), Hawaii (421), North Dakota (487) and West Virginia (554).
  • The five states with the highest foreclosure inventory as a percentage of all mortgaged homes were: Florida (9.7 percent), New Jersey (7.3 percent), New York (5.0 percent), Maine (4.4 percent) and Illinois (4.4 percent).
  • The five states with the lowest foreclosure inventory as a percentage of all mortgaged homes were: Wyoming (0.5 percent), Alaska (0.7 percent), North Dakota (0.7 percent), Nebraska (0.9 percent) and Montana (0.9 percent).

*February data was revised. Revisions are standard, and to ensure accuracy, CoreLogic incorporates newly released data to provide updated results.


Tuesday, April 16, 2013

$70.1 Million Awarded Through National Foreclosure Mitigation Counseling Program to Help Nearly 193,000 Families


WASHINGTON -- NeighborWorks America today announced that $70.1 million has been awarded to 30 state housing finance agencies (HFAs), 17 HUD-approved housing counseling intermediaries, and 72 community-based NeighborWorks organizations to provide counseling to families and individuals facing the threat of foreclosure. Just one month after the seventh round of National Foreclosure Mitigation Counseling (NFMC) Program funds were appropriated, communities across our country will be able to put the funds to immediate use.

When foreclosure is likely to affect more than one million people this year, the need for the NFMC funding is critical. Demand for NFMC grant funds remains high, with eligible applicants requesting more than $105 million in NFMC grant funds.

These grants are especially timely now, during Financial Literacy Month, since being aware of your financial options, including foreclosure prevention options, is what NeighborWorks America and the NeighborWorks network help families do every day.

In total, more than 1,200 nonprofit counseling agencies and local NeighborWorks organizations across the country are expected to be engaged in the NFMC Program as a result of these awards. These organizations provide invaluable, free assistance to families at risk of losing their homes, determine homeowner eligibility for the various state and federal foreclosure prevention assistance programs, help homeowners understand the complex foreclosure process, and identify possible courses of action so their homeowner clients can make informed decisions and take action.

To date, more than 1,560,000 families in all 50 states, Puerto Rico and Washington, D.C. have received foreclosure counseling through the NFMC Program. It is estimated that nearly 193,000 families facing the threat of foreclosure will be directly assisted with this seventh round of funding. Many more will be helped by the training of foreclosure counselors, provided through the NFMC Program. NeighborWorks expects to train 2,000 counselors with the seventh round of NFMC funding.

NFMC foreclosure prevention funding supports counseling that helps families through the long and complicated foreclosure process.  NeighborWorks America believes that a number of these families might not have fallen into foreclosure if they had the benefit of NeighborWorks pre-purchase housing counseling and education prior to becoming homeowners.

Last month, NeighborWorks America released new research on the effectiveness of NeighborWorks pre-purchase housing counseling and education. The research showed an average 33 percent decline in serious mortgage delinquency for homeowners who received NeighborWorks pre-purchase guidance compared to similar homeowners who didn't receive the same NeighborWorks pre-purchase help.

NFMC awardees are listed and more information is available at www.nw.org/nfmc.  

About NeighborWorks America

For 35 years, NeighborWorks America has created opportunities for people to improve their lives and strengthen their communities by providing access to homeownership and to safe and affordable rental housing. In the last five years, NeighborWorks organizations have generated more than $19.5 billion in reinvestment in these communities. NeighborWorks America is the nation's leading trainer of community development and affordable housing professionals.
SOURCE NeighborWorks America

Thursday, March 28, 2013

CoreLogic Reports 54,000 Completed Foreclosures in February


—Foreclosures Down 19 Percent Nationally Since February 2012—

IRVINE, Calif. —  CoreLogic®, a leading residential property information, analytics and services provider, today released its National Foreclosure Report for February which provides data on completed U.S. foreclosures and the overall foreclosure inventory. According to CoreLogic, there were 54,000 completed foreclosures in the U.S. in February 2013, down from 67,000 in February 2012, a year-over-year decrease of 19 percent. On a month-over-month basis, completed foreclosures fell from 58,000* in January 2013 to the February level of 54,000, a decrease of 7 percent.

As a basis of comparison, prior to the decline in the housing market in 2007, completed foreclosures averaged 21,000 per month nationwide between 2000 and 2006. Completed foreclosures are an indication of the total number of homes actually lost to foreclosure. Since the financial crisis began in September 2008, there have been approximately 4.2 million completed foreclosures across the country.

Approximately 1.2 million homes were in some stage of foreclosure in the U.S., known as the foreclosure inventory, as of February 2013 compared to 1.5 million in February 2012, a decrease of 21 percent. The foreclosure inventory as of February 2013 represented 2.8 percent of all homes with a mortgage compared to 3.5 percent in February 2012. This was the 16th consecutive month with a year-over-year decline. Month over month, the foreclosure inventory was down 1.8 percent from January 2013 to February 2013.

“February’s 54,000 completed foreclosures is the lowest level nationally since September 2007, with most major metropolitan areas experiencing improvements,” said Dr. Mark Fleming, chief economist for CoreLogic. “Even the major Florida markets are benefiting with the foreclosure inventories falling the fastest in major metropolitan areas, although from a very high level.”

“We continue to see a declining trend in foreclosure activity, with major markets leading the way,” said Anand Nallathambi, president and CEO of CoreLogic. “The drop in delinquencies and foreclosure starts will help support a resurgence in the home purchase market this year and next.”

Highlights as of February 2013:
  • ·         The five states with the highest number of completed foreclosures for the 12 months ending in February 2013 were: Florida (95,000),California (90,000), Michigan (73,000), Texas (57,000) and Georgia (49,000). These five states account for almost half of all completed foreclosures nationally.
  • ·         The five states with the lowest number of completed foreclosures for the 12 months ending in February 2013 were: District of Columbia (96), Hawaii (469), North Dakota (482), Maine (542) and West Virginia (588).
  • ·         The five states with the highest foreclosure inventory as a percentage of all mortgaged homes were: Florida (9.9 percent), New Jersey (7.2 percent), New York (5.0 percent), Nevada (4.6 percent) and Illinois (4.5 percent).
  • ·         The five states with the lowest foreclosure inventory as a percentage of all mortgaged homes were: Wyoming (0.5 percent), Alaska (0.6 percent), North Dakota (0.7 percent), Nebraska (0.8 percent) and Montana (0.9 percent).
  • ·          

*January data was revised. Revisions are standard, and to ensure accuracy, CoreLogic incorporates newly released data to provide updated results.


Wednesday, March 27, 2013

Facing Foreclosure Or Delinquency? Five Federal Programs Homeowners Should Review In 2013


FARMINGTON HILLS, Mich.  -- As homeowners receive their annual property assessments and taxable valuations in the mail, many will see the continued drop in the value of their home. Despite recent reports of declining "underwater" homeowners in the fourth quarter of 2012, there are still many homeowners looking for help.

"Property values are starting to creep up in some areas, but many homeowners are still underwater and owe more than their home is worth," said Rick Bialobrzeski , GreenPath director of communications. "Each week, we talk to hundreds of homeowners who are having trouble keeping up with their mortgage payments."

The GreenPath Debt Solutions housing department recently compiled a list of five government programs that homeowners should consider reviewing in 2013.

Here are the five housing programs, as compiled by GreenPath Debt Solutions.

1. HAMP Tier 1 and Tier 2 - The Home Affordable Modification Program (HAMP) has been extended through 2013 and expanded to help more homeowners.   HAMP Tier 2 is now an option for homeowners who:
  • Want to modify a home that is not their primary residence.
  • Previously did not qualify for HAMP, because their debt-to-income ratio was 31% or lower.
  • Previously received a HAMP trial plan, but defaulted on their trial payments.
  • Previously received a HAMP permanent modification, but defaulted on their payments.
  • Explore details at www.makinghomeaffordable.gov/programs/lower-payments/Pages/hamp.aspx. Or contact a HUD-approved housing counseling agency for a free assessment of your situation and possible options.


2. Home Affordable Foreclosure Alternatives (HAFA) Updates – This program is designed to help homeowners, whose loans are not backed by Fannie Mae or Freddie Mac, transition to more affordable housing.  HAFA provides two options for transitioning:  a short sale or a Deed-in-Lieu for foreclosure. 

In a short sale, the mortgage company lets a borrower sell their home for an amount that falls short of the amount they still owe.  In a Deed-in-Lieu, a borrower transfers the title of their home back to the mortgage company.
New policy changes for HAFA took effect February 1, 2013:
  • Servicers are required to make a decision on a borrower's request for a HAFA short sale within 30 days, down from 45 days. 
  • If a borrower is 90 days or more delinquent and has a FICO score less than 620, they are considered to have a "pre-determined hardship."  Borrowers with a pre-determined hardship must execute a hardship affidavit, but servicers do not have to further validate the hardship. 
  • Non-owner occupied properties are now eligible for short sales.
  • Up to $3,000 in relocation assistance may now be available to tenants living in a distressed property.
  • The amount the primary mortgage holder can pay to subordinate lien holders has been increased from $2,000 to $5,000.

These changes do not apply to mortgages backed by Fannie Mae or Freddie Mac.  Those agencies no longer participate with HAFA because they have their own Standard Short Sale and Standard Deed in Lieu guidelines.

3. Independent Foreclosure Review Alternative Settlement - In January, thirteen servicers subject to the Independent Foreclosure Review reached an agreement with federal regulators to pay more than $8.8 billion in cash payments and other assistance to help borrowers.  This agreement replaces the Independent Foreclosure Review program, which had not helped as many people as anticipated.  The agreement enacted a broader framework that allows eligible borrowers to receive compensation more quickly.  More than 3.9 million borrowers, whose homes were in foreclosure in 2009 and 2010, are expected to receive cash compensation in a timely manner.

Servicers include Aurora, Bank of America, Citibank, Goldman Sachs, HSBC, JP Mortgage Chase, Morgan Stanley, MetLife Bank, PNC, Sovereign, SunTrust, U.S. Bank and Wells Fargo.
Borrowers whose mortgage loan was serviced by one of the participating servicers and who were involved in a foreclosure action, between January 2009 and December 2010, will receive compensation, whether or not they filed a request for review form. Borrowers do not need to take further action to be eligible for compensation.  Payment agents will contact eligible borrowers by the end of March.

Borrowers who have questions about their eligibility or who need to update their contact information can call the toll-free Independent Foreclosure Review number at 888-952-9105.
4. Fannie Mae Refinancing Incentive - Fannie Mae announced in January that lenders will be allowed to offer a refinancing incentive.  These incentives would be used to obtain a lower payment or move to a more stable mortgage product. 

The lender may provide a borrower incentive that reduces the amount of the mortgage loan being refinanced, provided that:

The amount of the incentive does not exceed $2,000;
  • No repayment is required, and;
  • The payment is reflected on the HUD-1 Settlement Statement as a lender credit
  • Or the lender may provide a cash or cash-like (for example, a gift card) incentive that is not reflected on the HUD-1 Settlement Statement, provided that:
  • The amount of the incentive does not exceed $500, and
  • No repayment is required


5. Hardest Hit Funds -In 2007, the Federal government allocated Hardest Hit Funds to 18 states and the District of Columbia to help homeowners who are unemployed or underemployed.  Many of the states have recently made program changes to help more homeowners.  
States have until the end of 2017 to utilize the funds allocated through this program.   To find out more regarding specific Hardest Hit Fund programs in your state, contact the state Housing Finance Agency: www.ncsha.org/housing-help.

Hardest Hit Fund states include Alabama, Arizona, California, Florida, Georgia, Illinois, Indiana, Kentucky, Michigan,Mississippi, Nevada, New Jersey, North Carolina, Ohio, Oregon, Rhode Island, South Carolina, Tennessee and Washington, D.C.

GreenPath can assist homeowners by explaining these housing programs and other potential options. Counselors provide pre-purchase counseling for people interested in purchasing a home, foreclosure prevention counseling for people struggling to make their mortgage payment, and reverse mortgage counseling for seniors.  For more information, visit www.greenpath.org.

Tuesday, March 26, 2013

CoreLogic Reports Shadow Inventory Down 28 Percent From 2010 Peak


CoreLogic (CLGX), a leading residential property information, analytics and services provider, reported today that the overall shadow inventory is down 28 percent from its peak in January 2010, when it reached 3 million homes. Current residential shadow inventory as of January 2013 was at 2.2 million units, representing a supply of nine months. This figure represents an 18-percent drop from January 2012*, when shadow inventory stood at 2.6 million units. Shadow inventory is foreclosed property that is not yet on the market.

CoreLogic estimates the current stock of properties in the shadow inventory, also known as pending supply, by calculating the number of properties that are seriously delinquent, in foreclosure and held as real estate owned (REO) by mortgage servicers, but not currently listed on multiple listing services (MLSs). Transition rates of “delinquency to foreclosure” and “foreclosure to REO” are used to identify the currently distressed unlisted properties most likely to becomeREO properties. Properties that are not yet delinquent, but may become delinquent in the future, are not included in the estimate of the current shadow inventory. Shadow inventory is typically not included in the official reporting measurements of unsold inventory.

“The shadow inventory continued to drop at double the rate in January from prior-year levels. At this point in the recovery, we are seeing healthy reductions across much of the nation,” said Anand Nallathambi, president and CEO of CoreLogic. “As we move forward in 2013, we need to see more progress in Florida, New York, California, Illinois and New Jersey which now account for almost half of the country’s remaining shadow inventory.”

“The shadow inventory is declining steadily as properties are moving through the distressed pipeline,” said Dr. Mark Fleming, chief economist for CoreLogic. “States like Arizona, California and Colorado are experiencing significant declines year over year in the stock of serious delinquencies, a positive sign for further improvement in the shadow inventory.”

Data Highlights as of January 2013:

  • As of January 2013, shadow inventory was at 2.2 million units, or nine months’ supply, and represented 85 percent of the 2.6 million properties currently seriously delinquent, in foreclosure or REO.
  • Of the 2.2 million properties currently in the shadow inventory (Figures 1 and 2), 1 million units are seriously delinquent (4.1 months’ supply), 798,000 are in some stage of foreclosure (3.2 months’ supply) and 342,000 are already inREO (1.4 months’ supply).
  • The value of shadow inventory was $350 billion as of January 2013, down from $402 billion a year ago and down from $381 billion six months ago.
  • Over the twelve months ending January 2013, serious delinquencies, which are the main driver of the shadow inventory, declined the most in Arizona (40 percent), California (33 percent), Colorado (27 percent), Michigan (25 percent) and Wyoming (23 percent).
  • As of January 2013, Florida, California, New York, Illinois and New Jersey carried 44 percent of all distressed properties in the country. Florida continues to account for 16 percent of the nation’s distressed properties.


Saturday, February 2, 2013

The National Foreclosure Inventory Has Fallen 19.5 Percent From One Year Ago

CoreLogic Reports 767,000 Completed Foreclosures in 2012


RVINE, Calif., February 1, 2013 — CoreLogic® (NYSE: CLGX), a leading residential property information, analytics and services provider, today released its National Foreclosure Report, which provides data on completed U.S. foreclosures and the overall foreclosure inventory. According to CoreLogic, there were 56,000 completed foreclosures in the U.S. in December 2012, down from 71,000 in December 2011, a year-over-year decrease of 21 percent. On a month-over-month basis, completed foreclosures fell from 58,000* in November 2012 to the current 56,000, a decrease of 3 percent. As a basis of comparison, prior to the decline in the housing market in 2007, completed foreclosures averaged 21,000 per month between 2000 and 2006. Completed foreclosures are an indication of the total number of homes actually lost to foreclosure. Since the financial crisis began in September 2008, there have been approximately 4.1 million completed foreclosures across the country.

Approximately 1.2 million homes were in the national foreclosure inventory as of December 2012 compared to 1.5 million in December 2011, a 19.5 percent year-over-year decrease. Month over month, the national foreclosure inventory was down 4.2 percent from November 2012 to December 2012. The foreclosure inventory is the share of all mortgaged homes in any stage of the foreclosure process. The national foreclosure inventory as of December 2012 represented 3 percent of all homes with a mortgage.

“The most encouraging foreclosure trend reported here is that the inventory of foreclosed properties is almost 20 percent smaller than a year ago,” said Mark Fleming, chief economist for CoreLogic. “This big improvement indicates we are working toward resolving the backlog of the most distressed assets in the shadow inventory.”

“The rate of foreclosures continues to trend down, albeit at a slower rate as we exit 2012,” said Anand Nallathambi, president and CEO of CoreLogic. “This trend should continue into 2013 and is another positive signal that the gradual healing process in the housing market is gaining traction.”

Highlights as of December 2012:
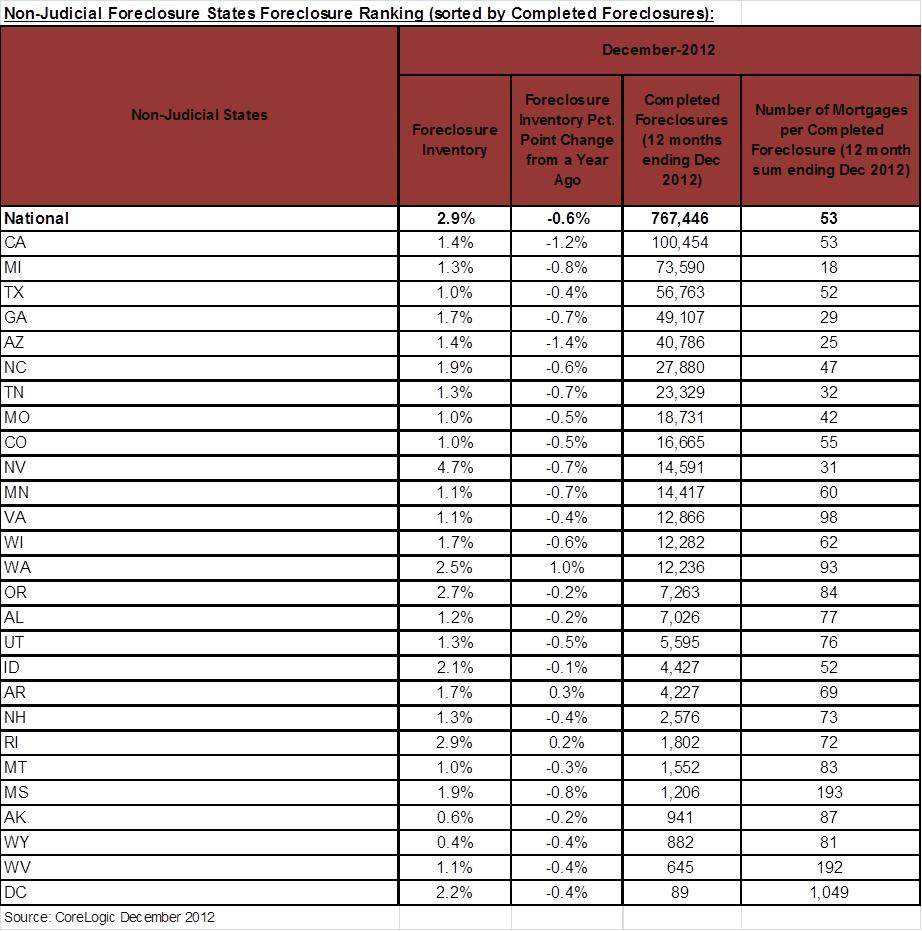
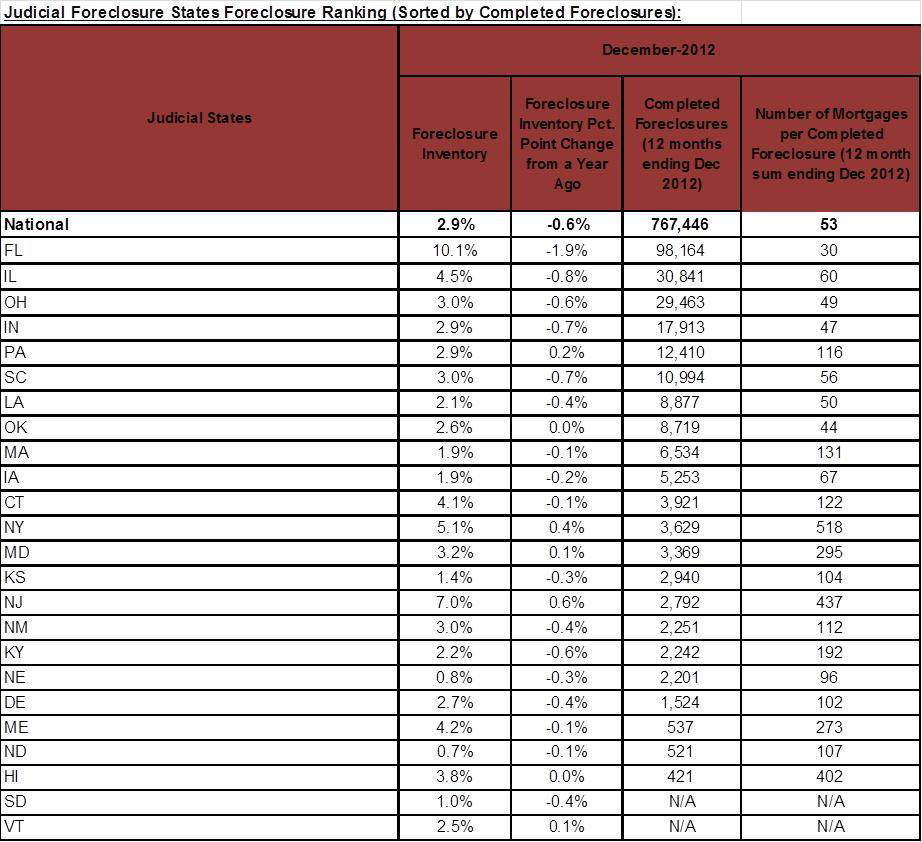
The five states with the highest number of completed foreclosures for the 12 months ending in December 2012 were: California (100,000), Florida (98,000), Michigan (74,000), Texas (57,000) and Georgia (49,000).These five states account for almost half of all completed foreclosures nationally.
The five states with the lowest number of completed foreclosures for the 12 months ending in December 2012 were: District of Columbia (89), Hawaii (421), North Dakota (521), Maine (537) and West Virginia (645).
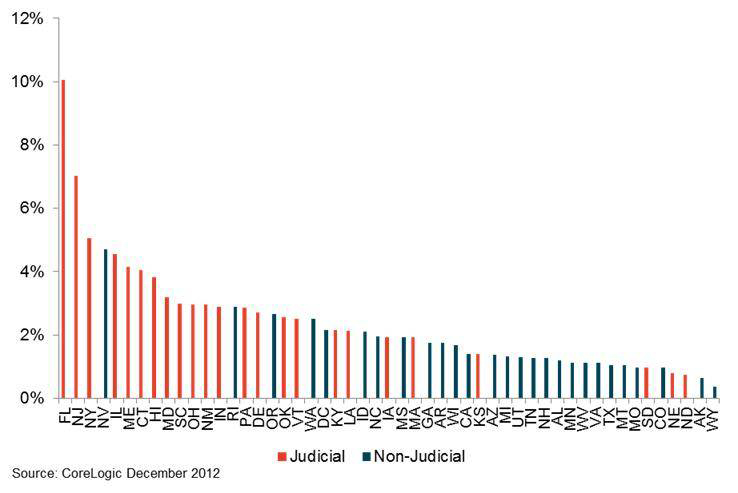
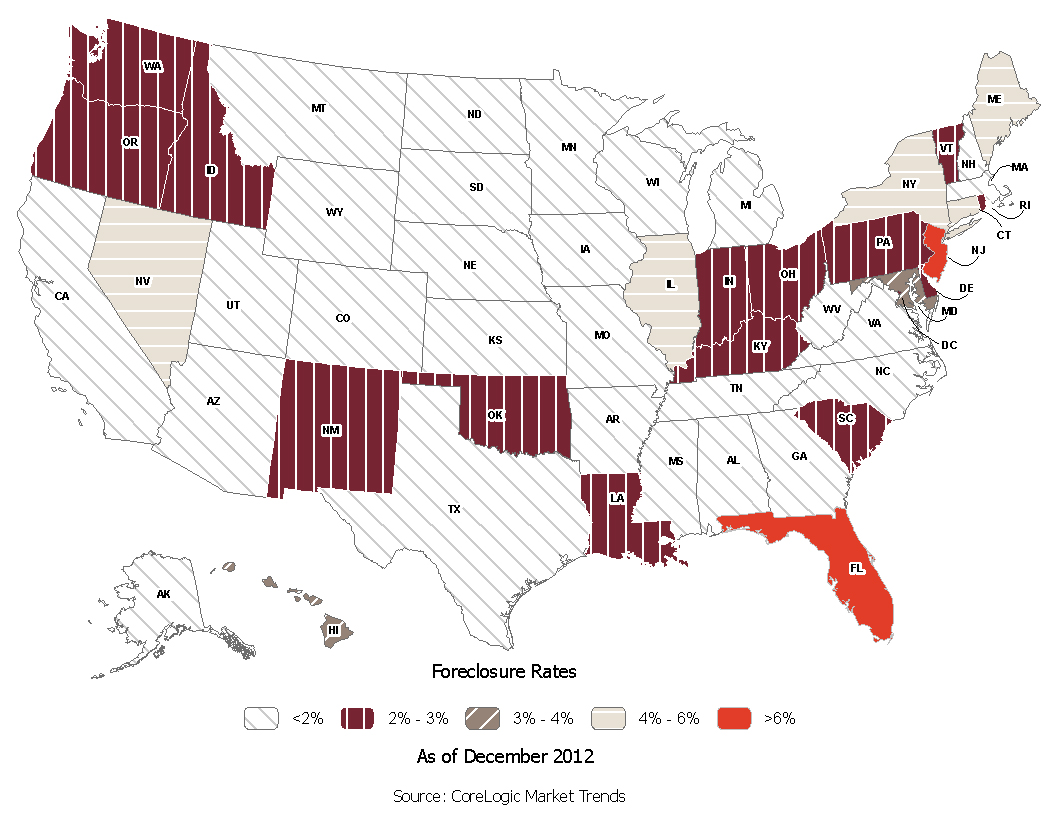
The five states with the highest foreclosure inventory as a percentage of all mortgaged homes were: Florida (10.1 percent), New Jersey (7.0 percent), New York (5.1 percent), Nevada (4.7 percent) and Illinois (4.5 percent).
The five states with the lowest foreclosure inventory as a percentage of all mortgaged homes were: Wyoming (0.4 percent), Alaska (0.6 percent), North Dakota (0.7 percent), Nebraska (0.8 percent) and Colorado (1.0 percent).

*November data was revised. Revisions are standard, and to ensure accuracy, CoreLogic incorporates newly released data to provide updated results.

Table 1 – Judicial Foreclosure States Foreclosure Ranking (Sorted by Completed Foreclosures)

Table 2 – Non-Judicial Foreclosure States Foreclosure Ranking (Sorted by Completed Foreclosures)

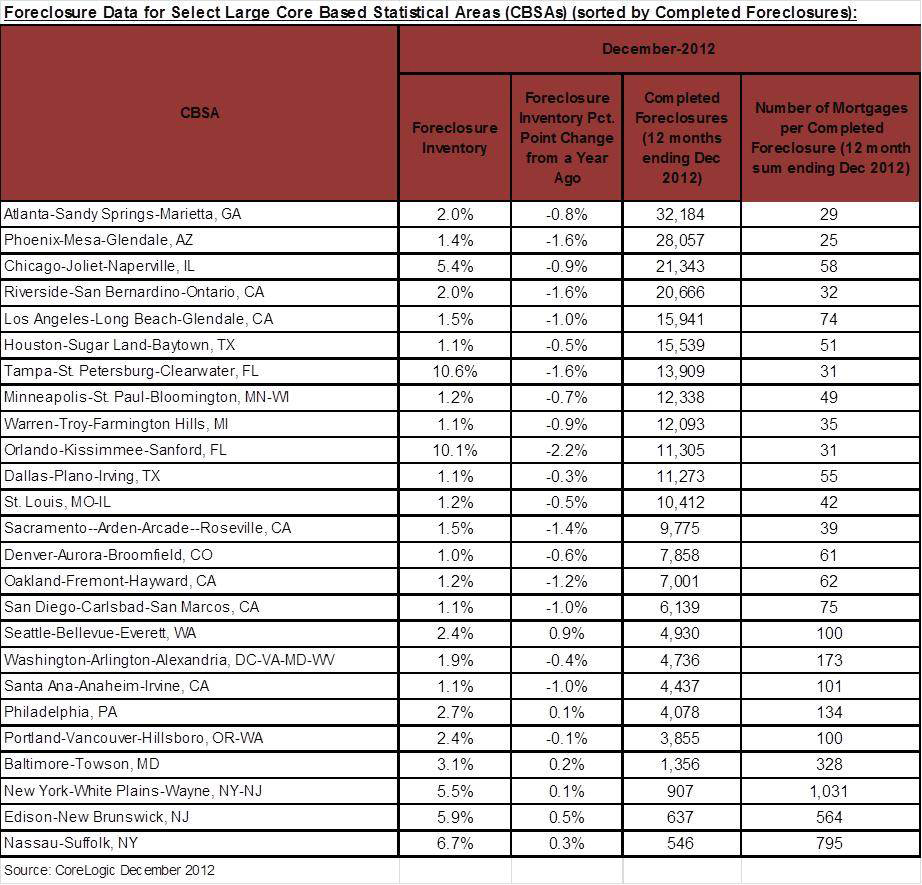
Table 3 – Foreclosure Data for Select Large Core Based Statistical Areas (CBSAs) (Sorted by Completed Foreclosures)

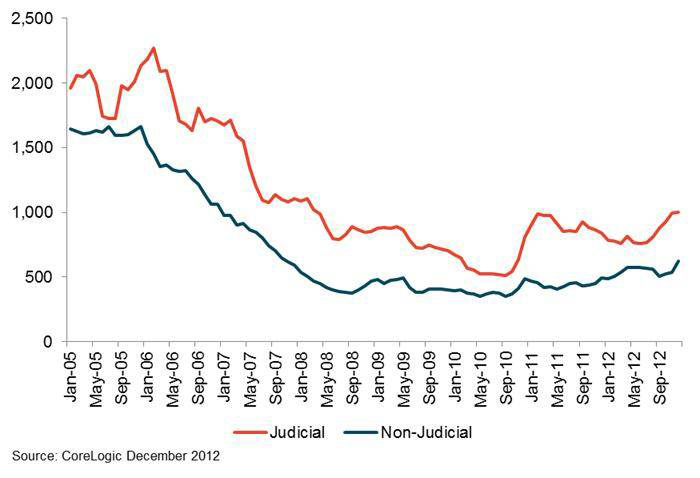
Figure 1 – Number of Mortgaged Homes per Completed Foreclosure
Judicial Foreclosure States vs. Non-Judicial Foreclosure States (3-month moving average)


Figure 2 – Foreclosure Inventory as of December 2012
Judicial Foreclosure States vs. Non-Judicial Foreclosure States


Figure 3 – Foreclosure Inventory by State Map