
Showing posts with label North Texas real estate market. Show all posts
Showing posts with label North Texas real estate market. Show all posts
Friday, October 20, 2017

Thursday, October 12, 2017

Monday, January 9, 2017

Monday, December 12, 2016

Monday, November 14, 2016

Monday, October 10, 2016

Thursday, October 6, 2016
Here Are the Best (and Worst) Cities to Own Investment Property
A rise in home prices might be bad news for buyers, but creates big opportunity for investors
For those looking to participate in the often volatile and profitable real estate market, GOBankingRates surveyed 61 out of the 100 most populous cities in the U.S. to find the best and worst cities to own investment property.
GOBankingRates analyzed the following factors:
Stand-Out Study Insights:
Five out of the ten best cities to own property are located in Florida and Texas.
Population levels are actually declining in places like Anchorage and Cleveland, pushing them to the bottom of the list.
When it comes to real estate investments, Midwest isn't best – none of the Midwest states made it into the top 15 of the best states to own investment property.
Seattle, Austin and Reno rank among the top 10 places to own investment property. However, it takes 17 to 19 years to pay off median home values in these cities based on yearly rents.
Methodology: GOBankingRates.com surveyed 61 of the 100 most populous U.S. cities, based on 2015 Census estimates, and evaluated each city by four main factors. (1) employment growth, sourced from the Bureau of Labor Statistics Economic Summaries in August 2016, with the percentage representing the employment change from June 2015 to June 2016 in each city; (2) population growth, based on and sourced from the 2014 and 2015 Census, with the percentage representing the change in population from 2014 to 2015; (3) increase in home values, based on Zillow Home Value, with the percentage representing the change in median home values for single-family homes from June 2015 to June 2016, sourced August 2016; (4) years to pay off property, which was based using the median home value for July 2016 and the median rent for a single family residence for July 2016, both sourced from Zillow; median rent was multiplied by 12 to obtain yearly rent and then home value was divided by yearly rent to determine how many years it would take for the home to be paid off from rental income using current home values and rent prices for each city.
For those looking to participate in the often volatile and profitable real estate market, GOBankingRates surveyed 61 out of the 100 most populous cities in the U.S. to find the best and worst cities to own investment property.
GOBankingRates analyzed the following factors:
- Employment growth: the percent change in the city's number of employed people year-over-year
- Population growth: the percent change in the city's population year-over-year
- Increase in home values: the percent change in the city's median home value year-over-year
- Years to pay off property: the number of years it would take for rental income to pay off the median home value
10 Best Cities to Own Investment Property
|
10 Worst Cities to Own Investment Property
|
1. Orlando, Fla.
|
1. Anchorage, Alaska
|
2. Tampa, Fla.
|
2. Pittsburgh
|
3. Denver
|
3. Chicago
|
4. Seattle
|
4. Virginia Beach, Va.
|
5. Austin, Texas
|
5. Cleveland
|
6. Reno, Nev.
|
6. Honolulu
|
7. Dallas
|
7. Detroit
|
8. Portland, Ore.
|
8. Tulsa, Okla.
|
9. Raleigh, N.C.
|
9. Omaha, Neb.
|
10. Miami
|
10. El Paso, Texas
|
"Growing populations in the top 10 cities on our list are fueling the need for more housing," said Cameron Huddleston, Life + Money columnist for GOBankingRates. "That's why these cities are such great places to own investment property now. On the other hand, the cities at the bottom of our list have seen little-to-no population growth, so the demand for housing isn't as high – which means real estate investors won't do as well there."
Stand-Out Study Insights:
Five out of the ten best cities to own property are located in Florida and Texas.
Population levels are actually declining in places like Anchorage and Cleveland, pushing them to the bottom of the list.
When it comes to real estate investments, Midwest isn't best – none of the Midwest states made it into the top 15 of the best states to own investment property.
Seattle, Austin and Reno rank among the top 10 places to own investment property. However, it takes 17 to 19 years to pay off median home values in these cities based on yearly rents.
Methodology: GOBankingRates.com surveyed 61 of the 100 most populous U.S. cities, based on 2015 Census estimates, and evaluated each city by four main factors. (1) employment growth, sourced from the Bureau of Labor Statistics Economic Summaries in August 2016, with the percentage representing the employment change from June 2015 to June 2016 in each city; (2) population growth, based on and sourced from the 2014 and 2015 Census, with the percentage representing the change in population from 2014 to 2015; (3) increase in home values, based on Zillow Home Value, with the percentage representing the change in median home values for single-family homes from June 2015 to June 2016, sourced August 2016; (4) years to pay off property, which was based using the median home value for July 2016 and the median rent for a single family residence for July 2016, both sourced from Zillow; median rent was multiplied by 12 to obtain yearly rent and then home value was divided by yearly rent to determine how many years it would take for the home to be paid off from rental income using current home values and rent prices for each city.
Thursday, September 29, 2016
Get into this home for virtually no money out of pocket
2404 Dogwood, Little Elm is in a USDA-eligible area. That means that qualified buyers can purchase the home with no down payment! On top of that, the seller is offering up to $5000 in closing cost assistance with an accepted offer, reducing the amount of money the buyer has to bring to the table!


Thursday, September 22, 2016

Friday, September 16, 2016
Is the Current Pace of Home Sales Sustainable?

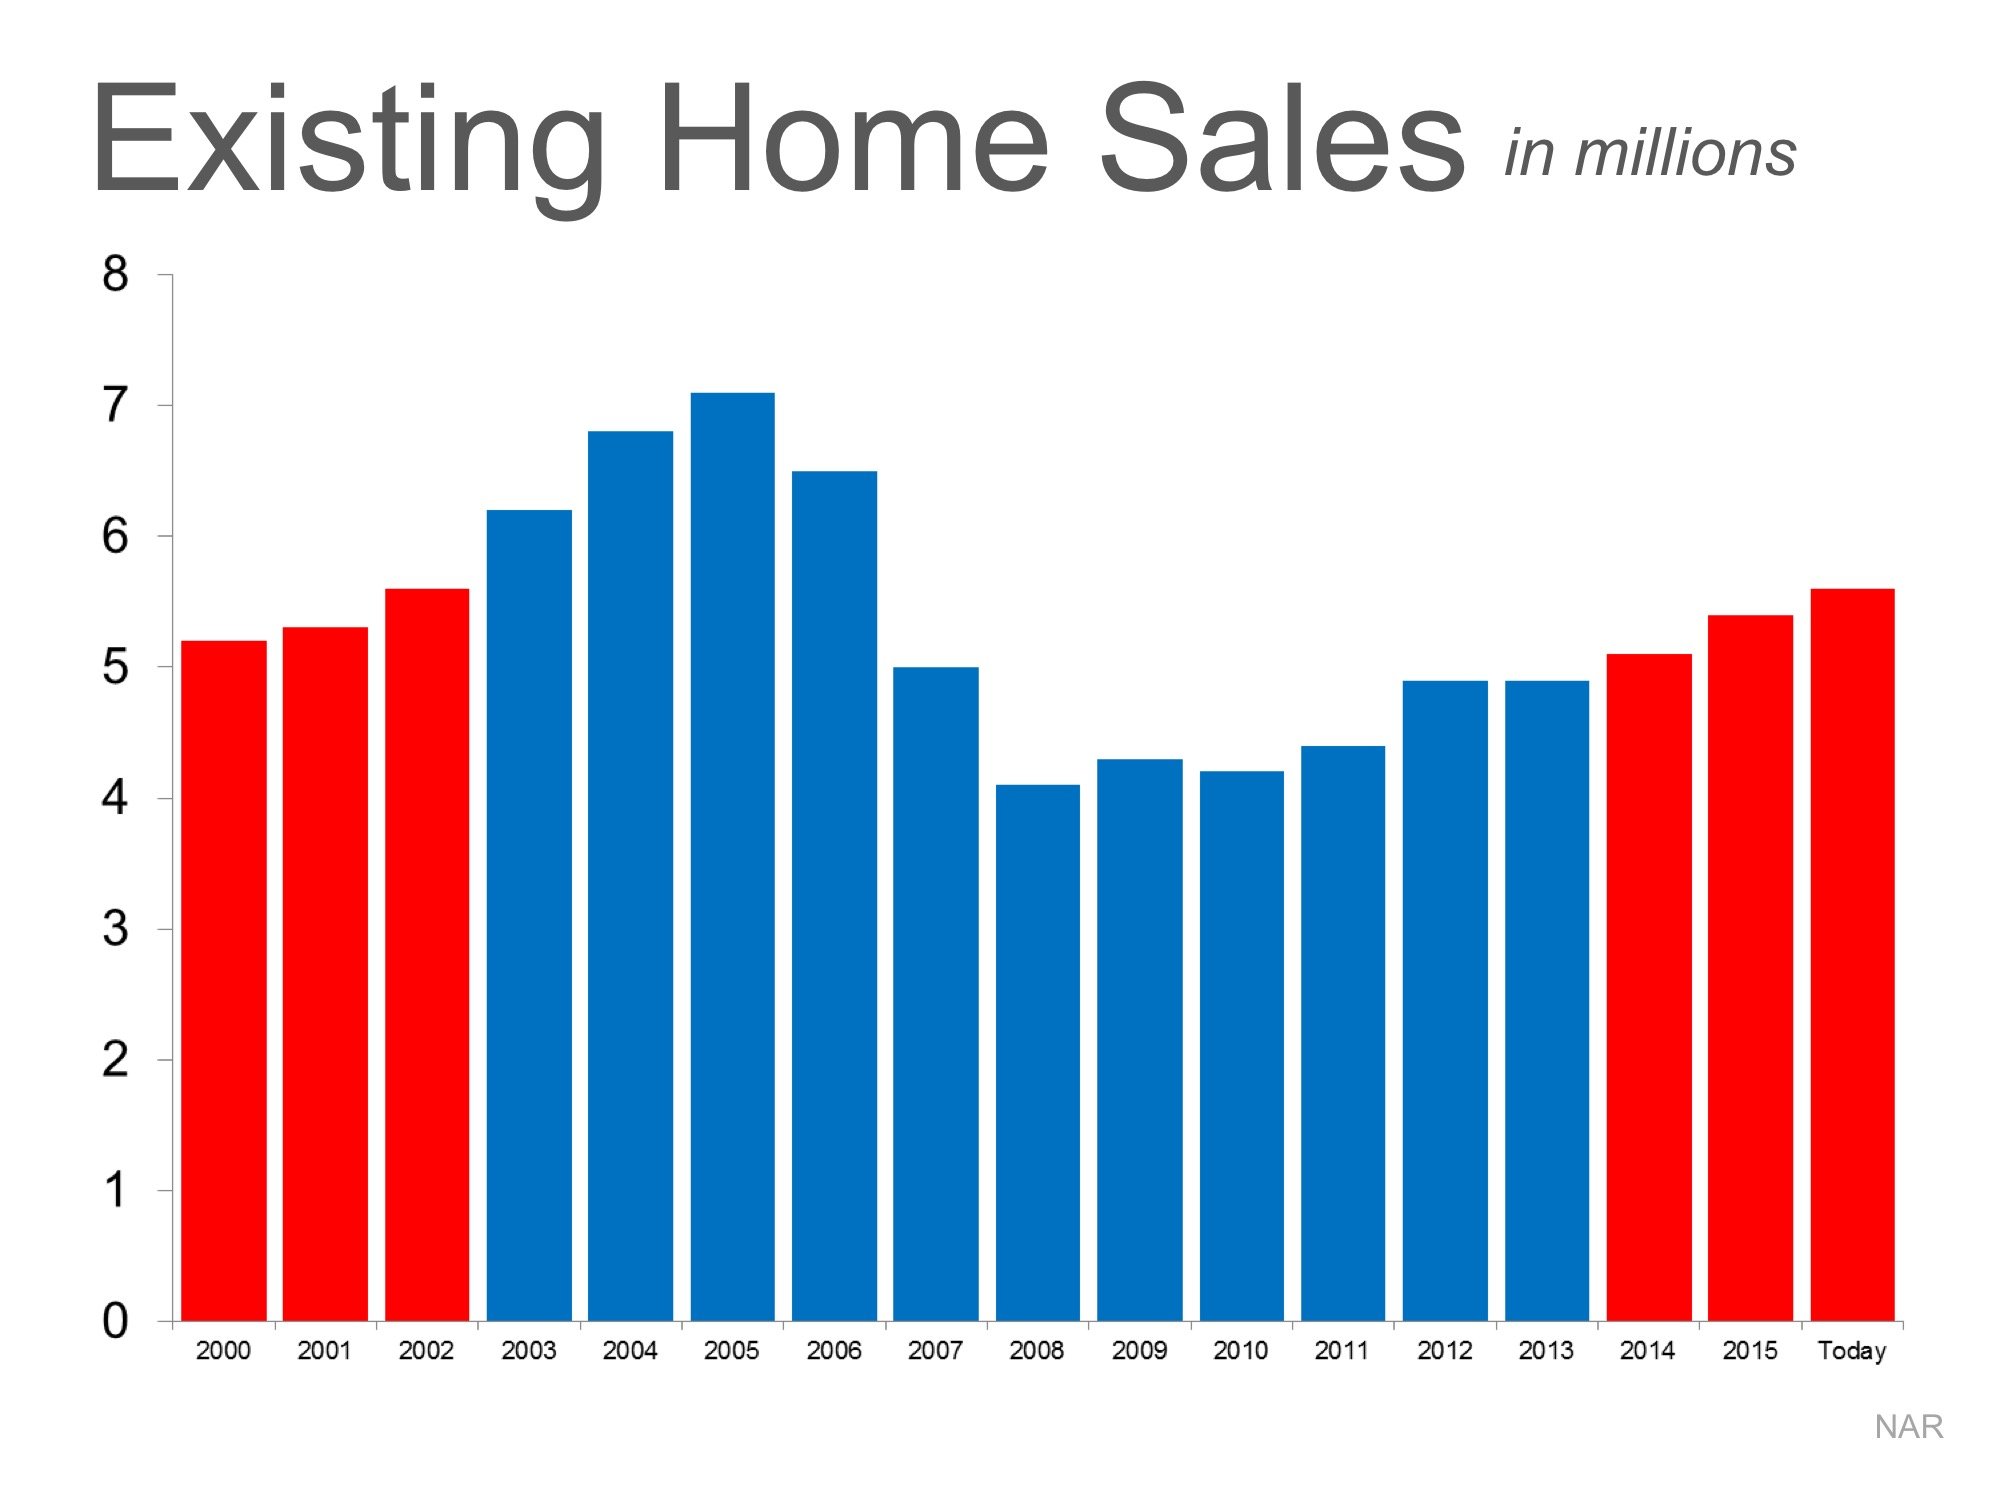
There are some experts questioning whether the current pace of residential home sales is sustainable. Are too many people buying homes like in 2004-2006? Are we headed for another housing crisis? Actually, if we look closely at the numbers, we can see that we are looking at a very healthy real estate market.
Why the concern?
Some are looking at the last three years of home sales and comparing them to the three years just prior to the housing bubble. Looking at the graph below, we can understand that thinking.
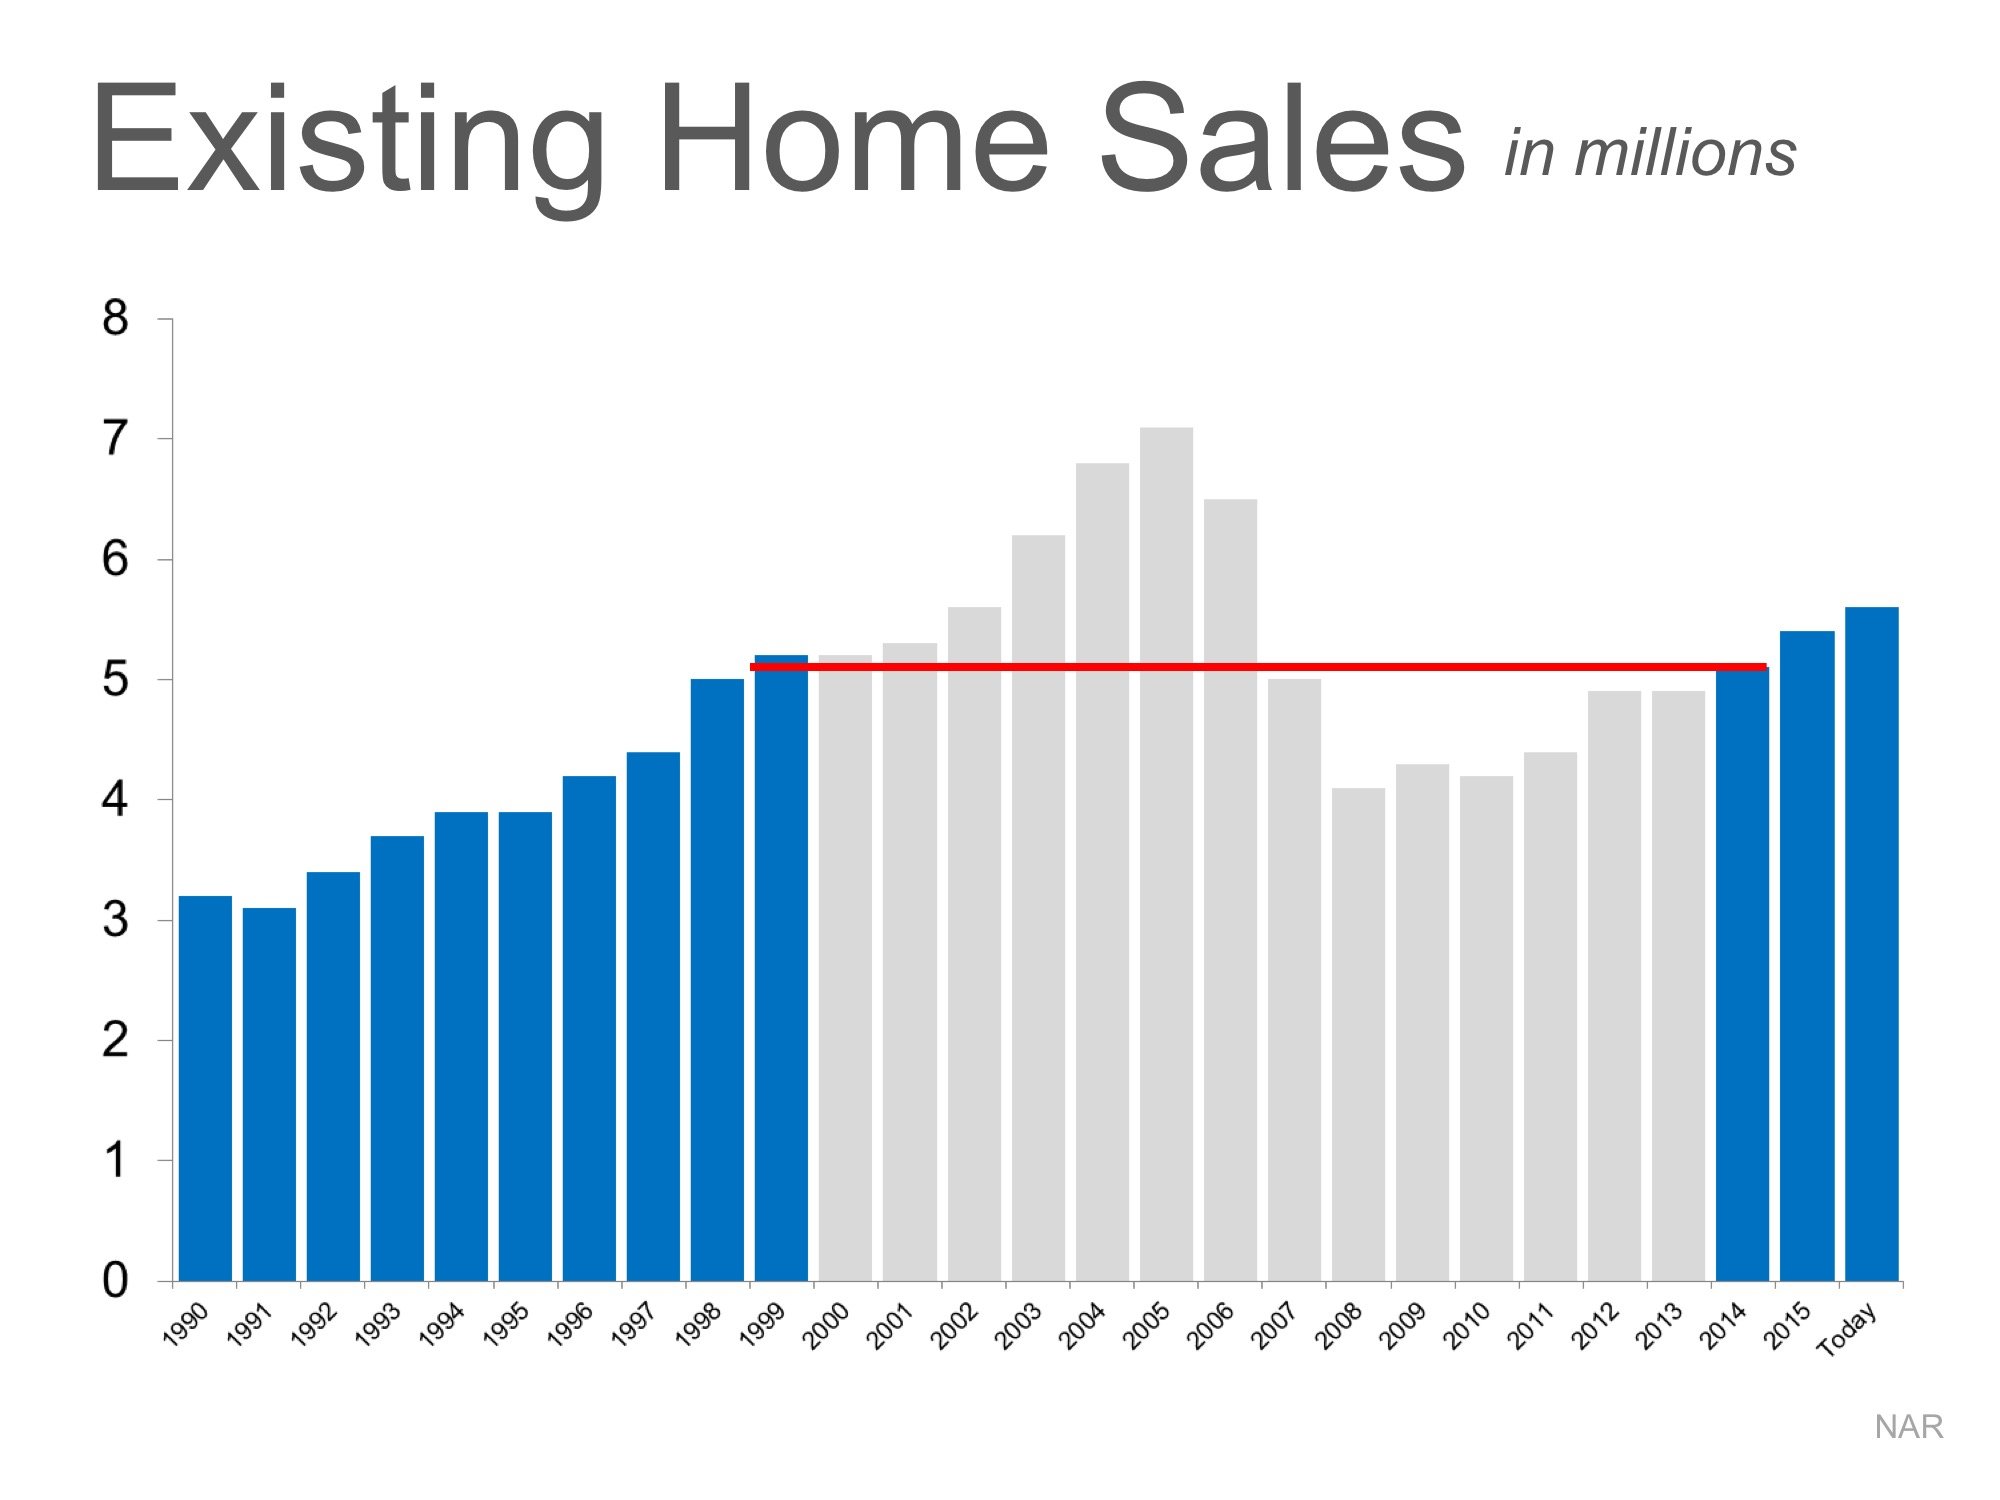
However, if we go further back in history, we can see the real picture. After taking out the “boom & bust” years, the pace of sales is growing at a quite natural pace.
And new home sales are way below historic numbers. Trulia’s Chief Economist Ralph McLaughlin explains:
“Adjusted for population, [new home sales] are at about 63% of their fifty-year average level—way better than 2011, but nowhere near heated.”
Bottom Line
The current pace of residential home sales definitely seems sustainable.
Monday, September 12, 2016

Monday, August 8, 2016

Saturday, July 16, 2016

Friday, June 17, 2016

Monday, June 13, 2016

Thursday, May 12, 2016

Monday, May 9, 2016

Monday, May 2, 2016
Texas home sales jump in first quarter of 2016, inventory drops to all-time low
Texas Association of Realtors releases 2016-Q1 edition of the Texas Quarterly Housing Report
Texas home sales rose significantly in the first quarter of 2016, while housing inventory fell to an all-time low, according to the 2016-Q1 Texas Quarterly Housing Report released today by the Texas Association of Realtors."Despite the economic downturn in some parts of the state, home sales continue to be strong, indicating the enduring demand of Texas real estate," said Leslie Rouda Smith, chairman of the Texas Association of Realtors. "Our state continues to be a hub for relocation activity, business development and job growth."
According to the report, 65,265 homes were sold in Texas in the first quarter of 2016, a 7.8 percent increase from the same quarter of 2015. Home prices continued to rise as well, with the median price for Texas homes increasing 5.4 percent year-over-year to $195,000.
Jim Gaines, Ph.D., economist with the Real Estate Center at Texas A&M University, added, "The Texas economy is experiencing a cooling off period after a five-year boom, so the Texas housing market's strong gains despite the current uneasiness in the state economy are remarkable. It will be interesting to see how Texas real estate activity performs in the next two quarters, typically the strongest quarters for home sales every year. That performance will show the full strength of the Texas housing market in 2016."
Housing inventory fell to an all-time low of 2.8 months in 2016-Q1, a decline of 0.6 months from the first quarter of 2015. The Real Estate Center at Texas A&M University estimates that a monthly housing inventory between 6.0 and 6.5 months is a level at which the supply and demand for homes is balanced.
Active listings also fell sharply in 2016-Q1, dropping 11.9 percent year-over-year to 74,276 active listings. Texas homes also continued to spend less time on the market. In 2016-Q1, Texas homes spent an average of 64 days on the market, a decrease of three days compared to the same quarter of the prior year.
Chairman Smith concluded, "Housing inventory remains extremely limited in Texas. Low housing inventory combined with rising property values is making housing affordability a challenge, not just in Texas's metro areas but across the state. This could become a larger problem if there is not greater balance between supply and demand in the future."
Saturday, April 23, 2016
First-Time Buyers Face Lack of Inventory and Higher Prices
Entry-level homes are rising in value the fastest in most large U.S. housing markets, making it tough for first-time buyers to enter the market this spring
- There are 5.9 percent fewer homes for sale in the U.S. than a year ago.
- There are 10.4 percent fewer entry-level homes for sale in the U.S. than a year ago.
- Low supply is driving up home prices among entry-level homes, which are often sought after by first-time buyers.
- National home values rose 4.8 percent to $186,200, according to the first quarter Real Estate Market Reports. Rents rose 2.6 percent to $1,389.
- There are 5.9 percent fewer homes for sale in the U.S. than a year ago.
- There are 10.4 percent fewer entry-level homes for sale in the U.S. than a year ago.
- Low supply is driving up home prices among entry-level homes, which are often sought after by first-time buyers.
- National home values rose 4.8 percent to $186,200, according to the first quarter Real Estate Market Reports. Rents rose 2.6 percent to $1,389.
Home values are rising the fastest among entry-level homes in more than half of the largest U.S. housing markets, according to first quarter Zillow® Real Estate Market Reports.i Rising home values in this segment of the market can be attributed to a lack of supply, with 10 percent fewer homes for sale this year compared to last.
The median value of entry-level homes, those in the bottom thirdii of the market, rose the most over the past year in Denver, up 20 percent, followed by Portland and Dallas. There are 13 percent fewer entry-level homes available in Denver than there were a year ago. The number of entry-level homes available declined the most in Portland. There are 40 percent fewer entry-level homes available in Portland than there were a year ago.
The findings signal difficult times ahead for first-time homebuyers looking to enter the market. Going into home-shopping season this spring, buyers will find fewer homes in the bottom and middle of the market -- the homes most affordable for first-time buyers. The trend also highlights the different experiences buyers are having in the recovering housing market. Buyers looking for the most expensive homes will find slower price growth, a larger selection, and less competition this spring than entry-level buyers who are likely to face stiff competition, bidding wars, and very few homes to choose from.
"It's going to be a tough home-buying market this spring, especially for first-time buyers or even people looking to move up into a slightly more expensive home," said Zillow Chief Economist Dr. Svenja Gudell. "In order to stand out in a competitive market, buyers should get pre-approved for a loan, find an agent who has experience with bidding wars, and consider coming in at the asking price, so the seller knows they're serious."
In all of the largest U.S. housing markets, more than a third of the homes available for sale are in the most expensive segment -- in the top third of the overall housing stock in the market. In nine markets, top-tier homes make up more than half of the inventory.
The most expensive homes on the market are more likely to have a price cut, a signal that there's less demand for top-tier homes. The share of top-tier listings with a price cut has increased 1.6 percentage points over the past year.
Metropolitan
Area |
First Quarter
2016 Zillow Home Value Index (ZHVI) |
Bottom-
Tier Percent Home Value Increase |
Bottom-
Tier Percent Inventory Change |
Middle-
Tier Percent Home Value Increase |
Middle-
Tier Percent Inventory Change |
Top-Tier
Percent Home Value Increase |
Top-Tier
Percent Inventory Change |
United States
|
$ 186,200
|
n/a
|
-10.4%
|
n/a
|
-10.4%
|
n/a
|
-1.9%
|
New York, NY
|
$ 384,100
|
-0.8%
|
-9.0%
|
1.8%
|
-3.6%
|
3.5%
|
4.7%
|
Los Angeles-Long Beach-Anaheim, CA
|
$ 565,400
|
6.2%
|
-26.3%
|
6.2%
|
-11.3%
|
8.1%
|
1.3%
|
Chicago, IL
|
$ 193,800
|
0.7%
|
-14.2%
|
3.1%
|
-10.5%
|
1.0%
|
2.0%
|
Dallas-Fort Worth, TX
|
$ 182,100
|
14.7%
|
-27.5%
|
13.0%
|
-32.5%
|
11.2%
|
-10.1%
|
Philadelphia, PA
|
$ 204,400
|
0.9%
|
-2.0%
|
1.9%
|
-6.4%
|
1.3%
|
0.5%
|
Houston, TX
|
$ 172,100
|
7.7%
|
n/a
|
6.4%
|
n/a
|
2.8%
|
n/a
|
Washington, DC
|
$ 364,100
|
2.8%
|
-10.8%
|
2.0%
|
-0.7%
|
1.0%
|
2.7%
|
Miami-Fort Lauderdale, FL
|
$ 230,600
|
11.7%
|
-3.6%
|
10.5%
|
7.8%
|
6.3%
|
15.4%
|
Atlanta, GA
|
$ 163,000
|
7.3%
|
-11.5%
|
6.3%
|
-11.9%
|
5.5%
|
1.3%
|
Boston, MA
|
$ 387,400
|
3.2%
|
-13.1%
|
4.9%
|
-4.8%
|
4.5%
|
14.6%
|
San Francisco, CA
|
$ 806,600
|
11.0%
|
-17.7%
|
11.5%
|
-6.7%
|
12.1%
|
1.7%
|
Detroit, MI
|
$ 123,100
|
-3.2%
|
2.0%
|
6.4%
|
-20.6%
|
2.8%
|
-3.6%
|
Riverside, CA
|
$ 304,200
|
10.0%
|
-3.8%
|
6.9%
|
-11.8%
|
2.7%
|
1.7%
|
Phoenix, AZ
|
$ 219,200
|
11.2%
|
-28.5%
|
8.4%
|
-11.6%
|
4.2%
|
-5.3%
|
Seattle, WA
|
$ 382,700
|
12.6%
|
-32.4%
|
11.7%
|
-24.4%
|
10.7%
|
-16.8%
|
Minneapolis-St Paul, MN
|
$ 219,400
|
5.2%
|
-7.9%
|
4.5%
|
-12.8%
|
2.1%
|
4.2%
|
San Diego, CA
|
$ 506,100
|
6.0%
|
-25.5%
|
5.7%
|
2.3%
|
5.2%
|
3.9%
|
St. Louis, MO
|
$ 141,900
|
2.3%
|
-3.0%
|
5.5%
|
-10.9%
|
5.4%
|
-6.6%
|
Tampa, FL
|
$ 163,600
|
10.3%
|
-28.1%
|
8.9%
|
-20.4%
|
6.2%
|
-12.4%
|
Baltimore, MD
|
$ 244,800
|
1.3%
|
-3.9%
|
1.5%
|
-3.9%
|
0.6%
|
-3.2%
|
Denver, CO
|
$ 333,500
|
20.3%
|
-12.7%
|
15.7%
|
5.4%
|
10.6%
|
-12.7%
|
Pittsburgh, PA
|
$ 126,700
|
2.9%
|
8.6%
|
1.8%
|
1.7%
|
3.0%
|
9.3%
|
Portland, OR
|
$ 322,000
|
16.2%
|
-39.5%
|
14.8%
|
-38.7%
|
13.5%
|
-19.7%
|
Charlotte, NC
|
$ 159,800
|
4.3%
|
-34.7%
|
5.1%
|
-34.5%
|
4.4%
|
-16.6%
|
Sacramento, CA
|
$ 339,700
|
13.0%
|
-22.3%
|
8.7%
|
-21.2%
|
7.1%
|
-8.6%
|
San Antonio, TX
|
$ 150,200
|
8.2%
|
n/a
|
6.7%
|
n/a
|
4.5%
|
n/a
|
Orlando, FL
|
$ 184,100
|
7.9%
|
-23.1%
|
7.9%
|
-16.0%
|
4.7%
|
-4.8%
|
Cincinnati, OH
|
$ 143,400
|
4.0%
|
-18.2%
|
3.9%
|
-20.0%
|
2.9%
|
-9.1%
|
Cleveland, OH
|
$ 125,500
|
-1.3%
|
-7.9%
|
2.5%
|
-11.0%
|
2.2%
|
0.8%
|
Las Vegas, NV
|
$ 203,200
|
9.1%
|
-11.1%
|
9.2%
|
-8.3%
|
5.8%
|
6.8%
|
Columbus, OH
|
$ 154,600
|
4.8%
|
-24.1%
|
5.7%
|
-13.7%
|
4.2%
|
-3.0%
|
Indianapolis, IN
|
$ 130,200
|
2.9%
|
-8.7%
|
2.7%
|
-22.4%
|
3.7%
|
-11.8%
|
San Jose, CA
|
$ 956,500
|
10.5%
|
-14.2%
|
12.6%
|
1.5%
|
12.1%
|
7.5%
|
Austin, TX
|
$ 247,500
|
10.1%
|
n/a
|
8.7%
|
n/a
|
6.8%
|
n/a
|
Virginia Beach, VA
|
$ 210,900
|
0.2%
|
1.1%
|
1.1%
|
2.4%
|
1.1%
|
0.0%
|
Subscribe to:
Posts (Atom)