Showing posts with label fun facts. Show all posts

Thursday, February 12, 2015

Valentine's Day Fun Facts

Expressing one's love to another is a celebrated custom on Valentine's Day. Sweethearts and family members present gifts to one another, such as cards, candy, flowers and other symbols of affection. Opinions differ as to who was the original Valentine, but the most popular theory is that he was a clergyman who was executed for secretly marrying couples in ancient Rome. In A.D. 496, Pope Gelasius I declared Feb. 14 as Valentine Day. Esther Howland, a native of Massachusetts, is given credit for selling the first mass-produced valentine cards in the 1840s. The spirit continues today with even young children exchanging valentine's cards with their fellow classmates.
Candy
1,379 Number of U.S. manufacturing establishments that produced chocolate products in 2012, employing 37,998 people. California led the nation with 152 of these establishments, followed by New York, with 119. 
Source: U.S. Census Bureau, County Business Patterns: 2012, NAICS code (31135)http://factfinder2.census.gov/bkmk/table/1.0/en/BP/2012/00A1/naics~31135
445 Number of U.S. establishments that manufactured nonchocolate confectionary products in 2012. These establishments employed 20,419 people. California led the nation in this category with 46 establishments.  
Source: U.S. Census Bureau, County Business Patterns: 2012, NAICS code (31134)  
http://factfinder2.census.gov/bkmk/table/1.0/en/BP/2012/00A1/naics~31134
$13.5 billion The estimated value of shipments in 2011 for firms producing chocolate and cocoa products.
Source: U.S. Census Bureau, 2011 Annual Survey of Manufactures, Products and Service Codes (311320 and 311330)
http://factfinder2.census.gov/bkmk/table/1.0/en/ASM/2011/31VS201//prodsvc~311320|311330
Nonchocolate confectionery product manufacturing, meanwhile, was an estimated $8.4 billion industry. 
Source: U.S. Census Bureau, 2011 Annual Survey of Manufactures, Products and Service Code (311340) 
http://factfinder2.census.gov/bkmk/table/1.0/en/ASM/2011/31VS201//prodsvc~311340
3,170Number of confectionery and nut stores in the United States in 2012. 
Source: U.S. Census Bureau, County Business Patterns, NAICS code (445292)http://factfinder2.census.gov/bkmk/table/1.0/en/BP/2012/00A1/naics~445292
Flowers
14,344 The total number of florist establishments nationwide in 2012. These businesses employed 62,397 people.  
Source: U.S. Census Bureau, County Business Patterns, NAICS code (4531) 
http://factfinder2.census.gov/bkmk/table/1.0/en/BP/2012/00A1/naics~4531
$294,730,180 The value of imports for cut flowers and buds for bouquets in 2014 through November. The total value of fresh cut roses as ofOctober 2014 was $407,807,220. 
Source: U.S. Census Bureau: Foreign Trade Division USA Trade Online U.S. Import and Export Merchandise trade (Commodity code-060319 and 060311)
https://usatrade.census.gov/
Jewelry
23,413 The estimated number of jewelry stores in the United States in 2012.  Jewelry stores offer engagement, wedding and other rings to couples of all ages. 
Sources: U.S. Census Bureau, County Business Patterns, NAICS code (448310)http://factfinder2.census.gov/bkmk/table/1.0/en/BP/2012/00A1/0100000US/naics~448310
"Please Be Mine"
29.0 and 26.6 years 
Median age at first marriage in 2013 for men and women, respectively. 
Source: U.S. Census Bureau, Families and Living Arrangements: 2013, 
http://www.census.gov/hhes/families/data/marital.html Table MS-2
52.7% The overall percentage of people 15 and older who reported being married. 
Source: U.S. Census Bureau, Families and Living Arrangements: 2013,
http://www.census.gov/hhes/families/data/cps2013A.html Table A1
68.6% Percentage of people 15 and older in 2013 who had been married at some point in their lives — either currently or formerly. 
Source: U.S. Census Bureau, Families and Living Arrangements: 2013,
http://www.census.gov/hhes/families/data/cps2013A.html Table A1
36.9              The provisional rate of marriages per 1,000 people performed in Nevada during 2011. So many couples tie the knot in the Silver State that it ranked number one nationally in marriage rates. Hawaii ranked second with a marriage rate of 17.6. 
Source: National Center for Health Statistics, 
http://www.cdc.gov/nchs/data/dvs/marriage_rates_90_95_99-11.pdf
2.1 million The provisional number of marriages that took place in the United States in 2011. That breaks down to nearly 5,800 a day.
Source: National Center for Health Statistics, 
http://www.cdc.gov/nchs/fastats/marriage-divorce.htm
74.5% 
The percentage of women who married for the first time between 1990 and 1994, who reached their 10th anniversary. This compares with 82.8 percent of women who married for the first time between 1960 and 1964. Men who married for the first time between 1990 and 1994, who reached their 10th anniversary was 77.3 percent. This compares with 83.4 percent who married for the first time between 1960 and 1964. 
Source: U.S. Census Bureau, Number, Timing, and Duration of Marriages and Divorces: 2009, 
http://www.census.gov/prod/2011pubs/p70-125.pdf Table 4
Giving Love a Second Chance
19.2% Among people 15 and older who have been married, the percentage of men and women in 2013 who have been married twice, and 5.3 percent have been married three or more times. By comparison, 75.5 percent of people who have been married have done so just once. 
Source: 2013 American Community Survey (Table B12505)http://factfinder.census.gov/faces/tableservices/jsf/pages/productview.xhtml?pid=ACS_13_1YR_B12505&prodType=table
8   Median length, in years, of first marriages that ended in divorce.
Source: Number, Timing, and Duration of Marriages and Divorces: 2009 http://www.census.gov/prod/2011pubs/p70-125.pdf Table 8
3.8 and 3.7 The median time in years between divorce and a second marriage for men and women, respectively. However, the two medians are not statistically different from each other.
Source: Number, Timing, and Duration of Marriages and Divorces: 2009 http://www.census.gov/prod/2011pubs/p70-125.pdf Table 8
9% and 7.9% Among people 15 and older in 2009, the percentage of men and women, respectively, who had married twice and were still married.
Source: Number, Timing, and Duration of Marriages and Divorces: 2009 http://www.census.gov/prod/2011pubs/p70-125.pdf Table 6
Looking for Love
393 The number of dating service establishments nationwide as of 2007. These establishments, which include Internet dating services, employed 3,125 people and pulled in $928 million in revenue. 
Source: U.S. Census Bureau, 2007 Economic Censushttp://factfinder2.census.gov/bkmk/table/1.0/en/ECN/2007_US/00A1//naics~8129902
Try Looking Here . . .Romantic-sounding places to spend Valentine's Day:          
Rose City, Texas 
(Population – 509)
Loveland, Colo.
(Population – 71,334)
Romeo, Colo.
(Population – 400)
Lovejoy, Ga.
(Population – 6,302)
Loves Park, Ill.
(Population – 23,703)
Lovington, Ill.
(Population – 1,116)
Romeoville, Ill.
(Population – 39,650)
Rosemont, Ill.
(Population – 4,236)
Romeo, Mich.
(Population – 3,582)
Rose City, Mich.
(Population – 640)
Darling, Minn.
(Population – 531)
Sacred Heart, Minn.
(Population  – 527)
Valentine, Neb.
(Population – 2,789)
Lovelock, Nev.
(Population – 1,958)
Loving, N.M.
(Population – 1,412)
Lovington, N.M.
(Population – 11,550)
Rosemont, Md.  
(Population – 304)                 
Love Valley, N.C.
(Population – 98)
South Heart, N.D.
(Population – 358)
Loveland, Ohio
(Population – 12,326)
Loveland Park, Ohio   
(Population – 1,523)
Love County, Okla.
(Population – 9,742)
Loveland, Okla.
(Population – 13)
Lovelady, Texas
(Population – 623)
Loving County, Texas
(Population – 95)       
Valentine, Texas
(Population – 129)
Rose Hill Acres, Texas
(Population – 445)
Source: U.S. Census Bureau, American FactFinder 
http://factfinder2.census.gov

Wednesday, January 28, 2015

Food Plays Major Role in Bowl Game Entertaining Menus

Omaha Steaks announced today that in a recent nationwide bowl game survey, more than 50 percent of those responding plan to watch the football championship bowl game at home with family and friends – and they plan to make food a centerpiece of their entertaining efforts.
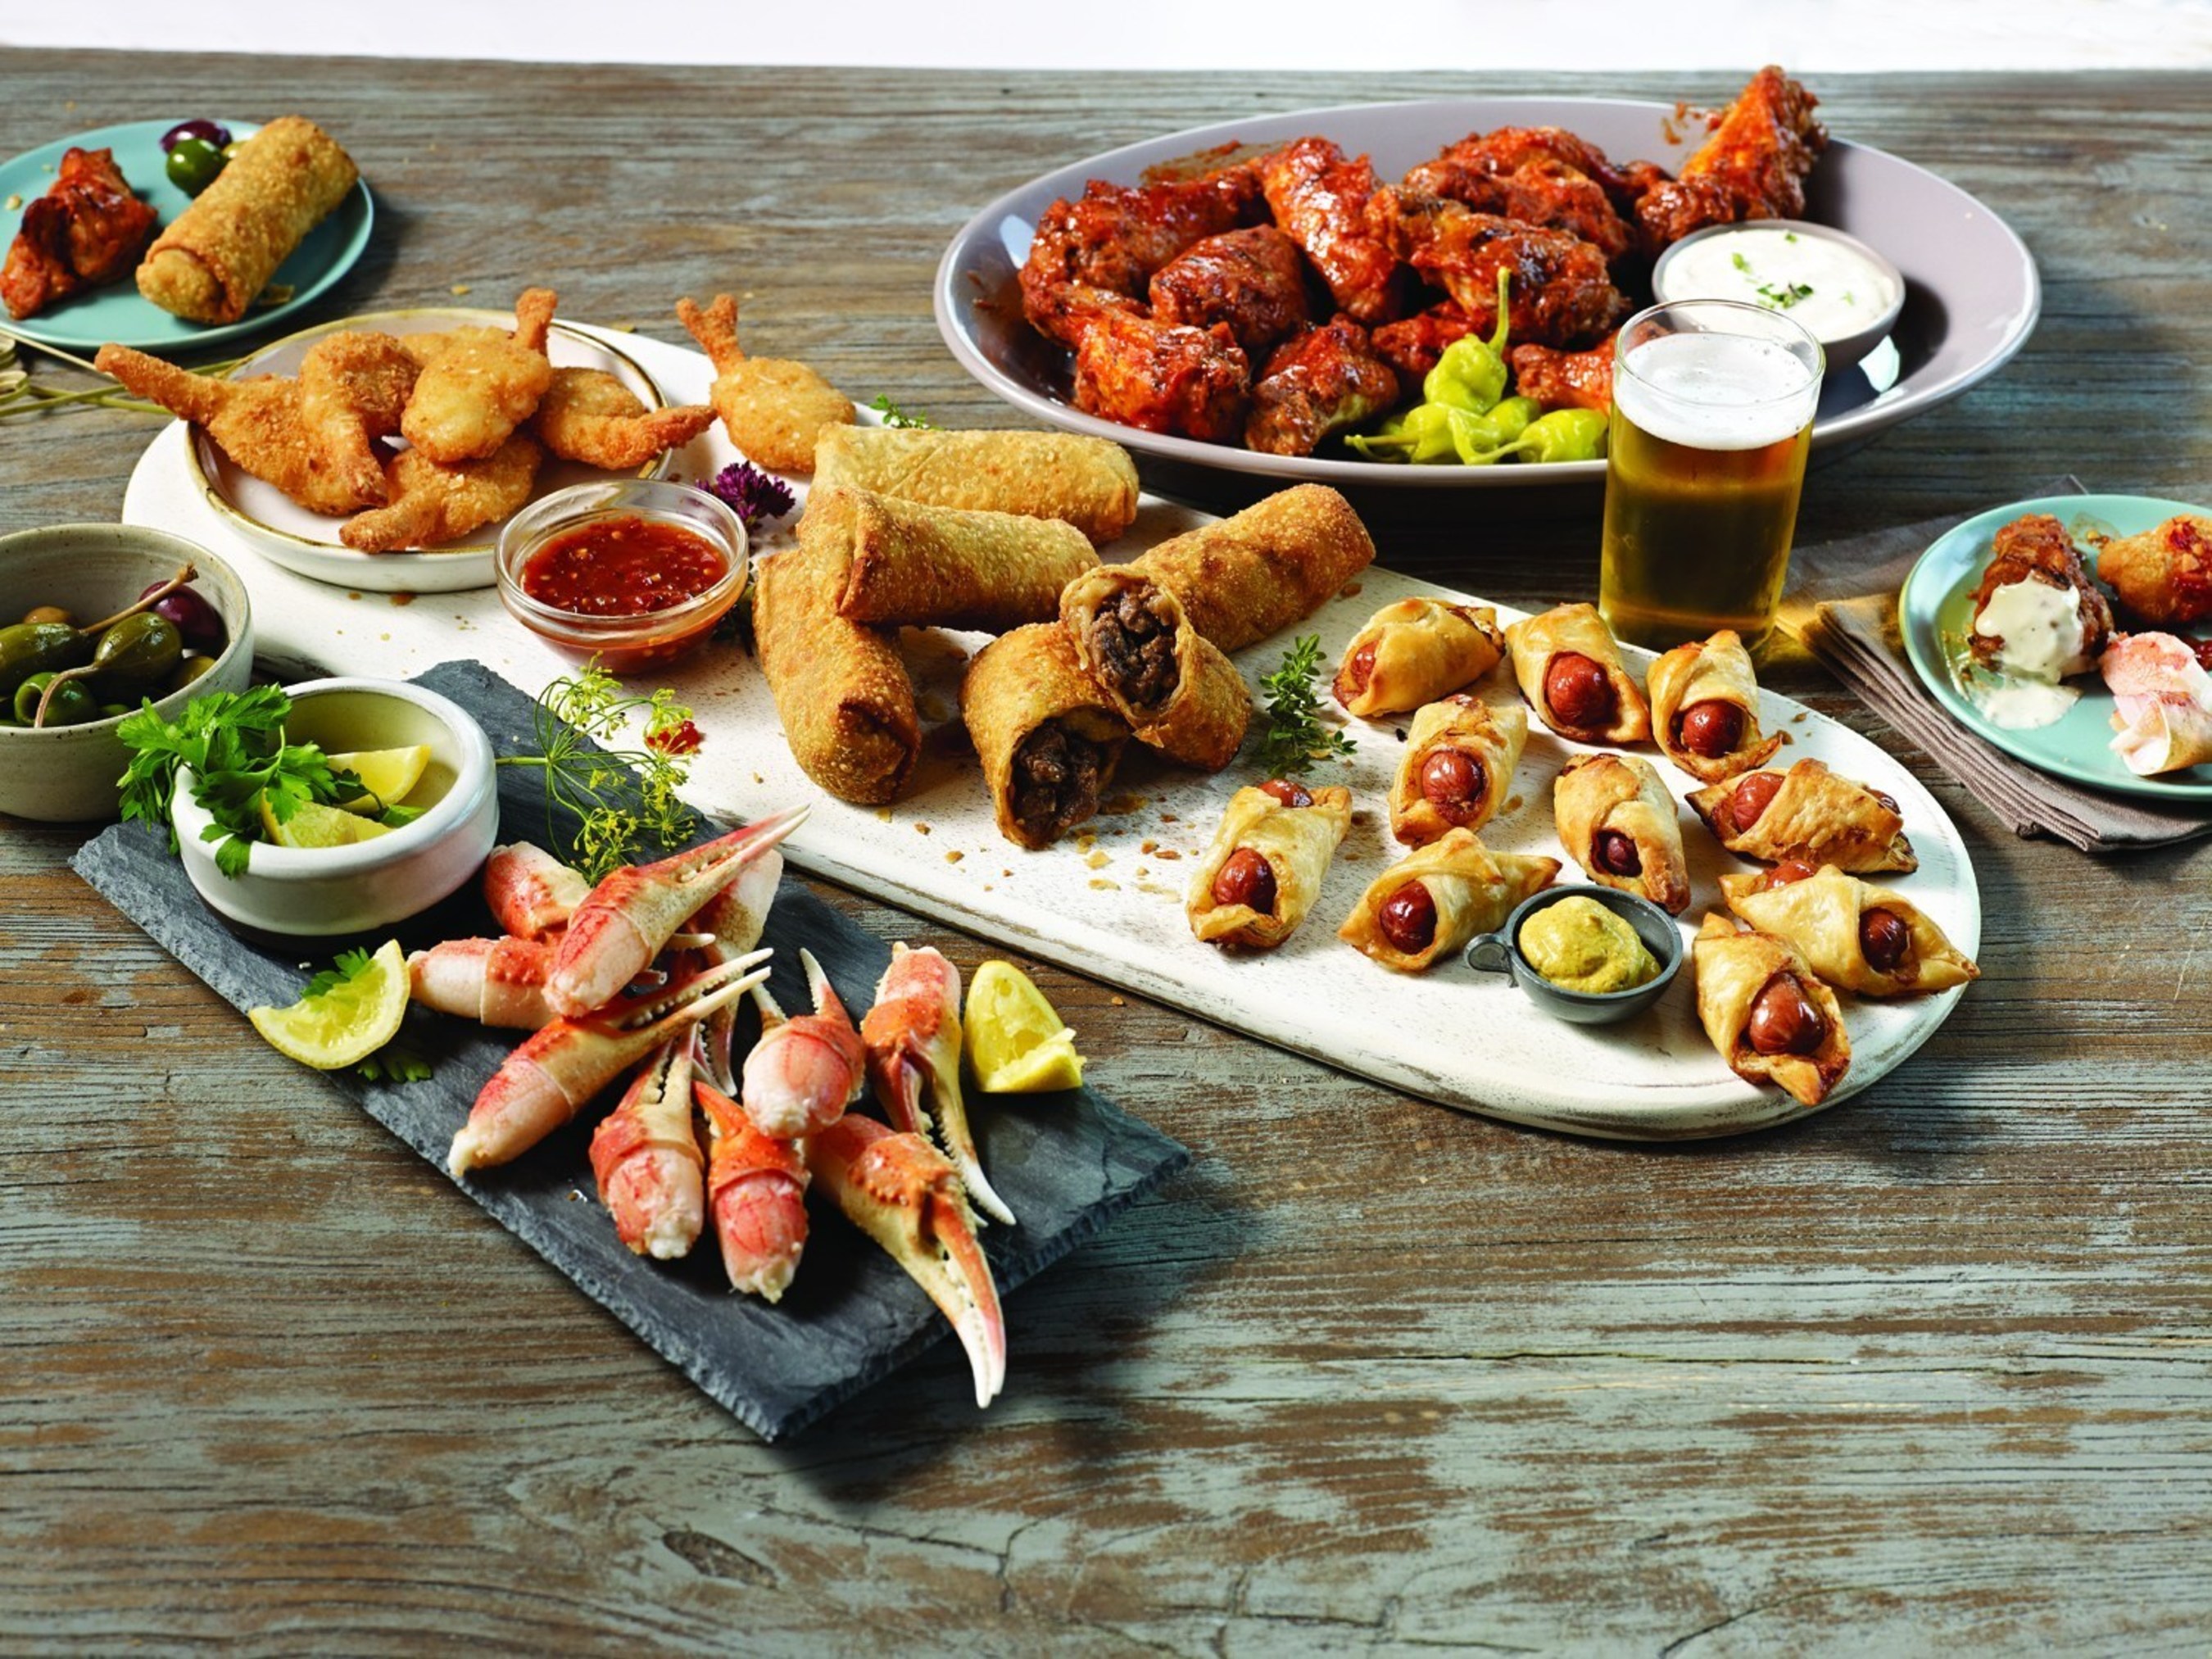
These apps from Omaha Steaks are so good, some folks might not even remember the game! This collection of gourmet favorites includes some of our finest World Port Seafood - sweet, crispy Coconut Shrimp and rich cracked Snow Crab Claws - along with plenty of our perfect Buffalo Wings and world-famous Franks in a Blanket. And, try this - the incredible, cross-cultural flavor of Omaha Steaks Filet Mignon Spring Rolls. What game?The Omaha Steaks survey revealed exactly what will be on party-goers' plates, with pizza (36.38%), burgers (23.67%) and sandwiches/cold cuts (22.76%) coming in as the top three main dishes served at bowl game gatherings. The survey results also showed the top meat appetizers as:
     1)    Wings (47.25%)
     2)    Hot Dips (33.27%)
     3)    Meatballs (33%)
     4)    Franks in a Blanket/Little Smokies (29.34%)
     5)    Shrimp (22.94%)
The results line right up with the National Retail Federation (NRF) Super Bowl Spending Survey, which indicates that 43 million people plan to host a bowl game party.
According to the Omaha Steaks survey results, drinks (79.71%) and appetizers (74.41%) are key to a winning bowl game menu. "Our recent survey proves what we anticipated were the top dishes served at Bowl Game gatherings and confirms Americans' love for football is perfectly paired with great food that brings people together," said Todd Simon, Senior Vice President and family owner of Omaha Steaks. "Omaha Steaks makes it easy to prepare a crowd-pleasing menu offering a wide variety of gourmet main dishes and appetizers available by phone, online or in our more than 70 retail stores nationwide."
In response to the survey results Omaha Steaks recently released the following Bowl Game recipes sure to please any crowd:
BBQ Meatballs and Garlic Mashed Potato Sliders
Omaha Steaks Bison Sliders with Chipotle Aioli
Omaha Steaks Buffalo Wings and Healthy Broccoli Crunch Slaw
A Soup Bar for the Big Game

Saturday, January 24, 2015

Americans to Eat 1.25 Billion Chicken Wings for Super Bowl

With the second biggest eating day of the year after Thanksgiving upon us – Super Bowl Sunday – there's no hotter time of year for chicken wings, which have become a staple food on Super Bowl menus.   
According to the National Chicken Council's 2015 Wing Report released today, 1.25 billion wings will be eaten during Super Bowl XLIX, as fans watch the Seattle Seahawks and New England Patriots battle for the Lombardi Trophy, matching the record tied last year when the Seahawks defeated the Denver Broncos.  
To put that into perspective, if 1.25 billion wing segments were laid end to end, they would stretch back and forth from CenturyLink Field in Seattle to Gillette Stadium in Foxborough, Massachusetts… almost 28 times.  With the Super Bowl being played in Arizona, 1.25 billion wings would circle the Grand Canyon 120 times.  That is enough wings to put 572 wings on every seat in all 32 NFL stadiums, according to the Council.    
In terms of weight, 1.25 billion wings would weigh 5,955 times more than the weights of the Seahawks and Patriots entire 52-man rosters combined. 
"Although the total amount of pounds of chicken produced last year rose by about 1.8 percent, the total number of chickens processed was virtually the same in 2014 as is was in 2013," noted National Chicken Council Vice President of Communications Tom Super.  "A chicken only has two wings; therefore, the supply of wings is limited by the total number of chickens produced."
The average price (wholesale, not retail) of whole wings is currently $1.71/lb, up from $1.35/lb at the same time last year, according to the Daily Northeast Broiler/Fryer Report by the U.S. Department of Agriculture's Agriculture Marketing Service.  This is down significantly from when wing prices hit a record high of $2.11/lb in January, 2013. 
Wing prices traditionally go up in the fourth quarter of the year as restaurants and supermarkets stock up for the Super Bowl, and prices usually peak in January during the run-up to the big game. 
Wing Eating among NFC-AFC Championship Cities
While Seattle is known for many things, including its coffee, fish tossing and Fortune 500 companies, chicken wings aren't one of them. 
Residents of Seattle tend to punt on chicken wings, as they are 17 percent less likely to eat chicken wings in general than the average resident of the top 42 U.S. markets, according to The NPD Group's Local Market CREST Restaurant database; two years ending September 2014.  While faring a bit better, but still below average, Patriots fans in Boston are 8 percent less likely to consume wings from a restaurant than the average resident.
But the Seahawks-Patriots matchup was the best possible scenario out of the four remaining NFL playoff teams/cities for wing eating.  Here' a look at how the four stack up:
  • Boston: 8 percent less likely to eat chicken wings in general than the average resident
  • Seattle: 17 percent less likely to eat wings
  • Indianapolis: 32 percent less likely to eat wings
  • Green Bay: 39 percent less likely to eat wings
"The good news is, fans will try more wings if their team gets in the Super Bowl," noted Harry Balzer, The NPD Group's chief industry analyst and vice president. "We know wing consumption increases more than other foods during the Super Bowl.  It did in Seattle last year after they won.  While the citizens of Seattle still eat wings less often than the average eater, our research indicates that order incidence for wings rose considerably last year in that market." 
Added the Chicken Council's Super, "With the Patriots in the game, we're hopeful this trend will continue and we'll see 'inflated' wing consumption this year in New England." 
Super Bowl Fans Choose Sides
The data shows that more than four in five U.S. adults (81 percent) eat chicken wings, holding steady from last year. 
More than half (56 percent) of U.S. adults who eat chicken wings say they typically like to eat their wings with ranch dressing, according to a new National Chicken Council poll conducted online in January 2015 by Harris Poll*.  Ranch is once again the #1 side or sauce typically eaten with wings, up from 51 percent last year but shy of the record of 57 percent two years ago.  Only about one-third (36 percent) like to eat their wings with blue cheese dressing.  This is up from 32 percent last year.  Barbecue sauce even topped blue cheese, coming in at 42 percent. 
The survey asked which dipping sauces or snacks chicken wing eaters typically like to eat with their wings. They could choose more than one option. 
Northeastern wing eaters are significantly more likely to prefer blue cheese dressing (49 percent) than those in the Midwest (36 percent), South (30 percent) and West (30 percent), while those regions are more likely to prefer ranch dressing. 
"I was shocked to see Blue Cheese go down by this margin, again," noted Super.  "Although, I'm from the Northeast – for me, putting Ranch on wings is like putting ketchup on a hot dog."
After ranch dressing at the top:  42 percent of wing lovers choose barbecue sauce as a typical snack or dipping sauce; 36 percent said blue cheese; 36 percent hot sauce; 35 percent celery; and 20 percent choose carrots. Ten percent of wing lovers describe themselves as purists who eat nothing with their wings.  
Bone-in or Boneless? 
With the growing popularity of "boneless wings," NCC asked wing eaters if they prefer to eat traditional, bone-in wings or boneless wings.  According to the survey, 54 percent of wing eaters prefer traditional, bone-in wings while 46 percent chose their boneless cousin.  Boneless wings are typically white, boneless chicken breasts cut into strips, breaded or floured and tossed with Buffalo sauce.   
The Drumette, Flat or Whole Wing?
The vast majority of wings, especially those destined for restaurants, are disjointed, with the third joint (the thin part known as the wing tip or flapper) being exported to Asian countries and the meatier first and second joints being sold domestically.  The wing is usually split into two parts – or segments – known as the "drumette" and the "flat" and sold to restaurants or retail grocery outlets.  (For a picture of the wing parts, click here.)
According the survey, of those who eat chicken wings, 46 percent prefer the drumette, 25 percent the flat and 10 percent prefer their wings whole.  Nineteen percent say they don't have a preference, they like them all.
For more information on wings, including their history, relationship with football, recipes and more, visit the National Chicken Council website for the full 2015 Wing Report.   

Wednesday, January 7, 2015

U.S. Postal Service Delivers Record Holiday Season

The U.S. Postal Service exceeded its holiday delivery projections this season, delivering approximately 524 million packages in December — an 18 percent increase over last year.
On Dec. 22 alone, the Postal Service delivered more than 28 million packages. This marked the most packages delivered in a single day in the organization's history. The package delivery record was set while also delivering approximately 463 million pieces of mail.
Improving tracking and reliability for customers was a key factor in preparing for holiday delivery demand. In advance of the holidays, the Postal Service also lowered some prices for businesses and frequent shippers.
"The volume this holiday season demonstrates that retailers and consumers increasingly are turning to the Postal Service to deliver their packages," said Postmaster General and Chief Executive Officer Patrick Donahoe. "We know how much our customers count on us to make sure cards, letters and gifts make it home, and I'm proud that we delivered on our promise."
In preparation for the holiday package volume, the Postal Service enhanced its network and made adjustments to mail processing and delivery operations, including delivering packages seven days a week beginning late November. More than 20 million packages were delivered on the five Sundays prior to Christmas to keep the mail moving and networks clear. An additional 118,000 packages were delivered Christmas Day.
"The dedication and resolve of our employees is commendable," Donahoe said. "They adapted and delivered heavier-than-ever volumes of packages. They worked extremely hard, many of them braving harsh weather. I'm honored by the commitment they demonstrated this holiday season."
The Postal Service is continuing to anticipate holiday volume through January as consumers use the mail to return holiday gifts. Merchants and retailers can take advantage of several return services, including Priority Mail Returns Service, to help customers make their returns easier. Consumers with gifts to return can pack items in Priority Mail packaging, which comes with insurance and tracking, and is available free at Post Offices or online.         
The Postal Service receives no tax dollars for operating expenses and relies on the sale of postage, products and services to fund its operations.
For more information about the Postal Service, visit usps.com and usps.com/postalfacts.

Wednesday, December 24, 2014

The 2014 Holiday Season

This festive season, or simply the holidays, is a time for gathering and celebrating with family and friends, gift giving, reflection and thanks. To commemorate this time of year, the U.S. Census Bureau presents the following holiday-related facts and figures from its collection of statistics.     
Rush to the Stores
$24.4 billion Estimated retail sales by the nation's department stores (including leased departments) in December 2013. This represents an estimated 40.9 percent jump from the previous month when retail sales were estimated at 17.3 billion. No other month-to-month increase in department store sales last year was as large.
Source: U.S. Census Bureau, Monthly Retail Trade Survey 
http://www.census.gov/econ/currentdata/dbsearch?program=MRTS&startYear=2013&endYear=2013&categories=4521I&dataType=SM&geoLevel=US&notAdjusted=1&submit=GET+DATA
Note: Leased departments are separately owned businesses operated as departments or concessions of other service establishments or of retail businesses, such as a separately owned shoeshine parlor in a barber shop, or a beauty shop in a department store. Also, retail sales and inventory estimates have not been adjusted to account for seasonal or pricing variations.
13.9% The estimated percentage of total 2013 sales for department stores (including leased departments) in December. For jewelry stores, the estimated percentage was 19.1 percent. 
Source: U.S. Census Bureau, Monthly Retail Trade Survey
http://www.census.gov/econ/currentdata/dbsearch?program=MRTS&startYear=1992&endYear=2013&categories=4521I&dataType=SM&geoLevel=US&notAdjusted=1&submit=GET+DATA
22.8% 
The estimated growth in inventories by our nation's department stores (excluding leased departments) from Aug. 31 to Nov. 30, 2013.
Source: U.S. Census Bureau, Monthly Retail Trade Survey
http://www.census.gov/econ/currentdata/dbsearch?program=MRTS&startYear=1992&endYear=2013&categories=4521E&dataType=IM&geoLevel=US&notAdjusted=1&submit=GET+DATA
$44.5 billion  Estimated value of retail sales by electronic shopping and mail-order houses in December 2013 — the highest total for any month last year. 
Source: U.S. Census Bureau, Monthly Retail Trade Survey
http://www.census.gov/econ/currentdata/dbsearch?program=MRTS&startYear=1992&endYear=2013&categories=4541&dataType=SM&geoLevel=US&notAdjusted=1&submit=GET+DATA
30,185 The number of electronic shopping and mail-order houses in business in 2012. These businesses, which employed 365,508 workers in the pay period including March 12, are a popular source of holiday gifts.
Source: U.S. Census Bureau, 2012 County Business Patterns
http://factfinder2.census.gov/bkmk/table/1.0/en/BP/2012/00A1//naics~45411
Christmas Trees and Decorations
$1.0 billion The value of U.S. imports of Christmas tree ornaments from China between January and September 2014. China was the leading country of origin for such items. Similarly, China was the leading foreign source of artificial Christmas trees shipped to the United States ($137.5 million worth) during the same period. 
Source: U.S. Census Bureau, Foreign Trade Statistics
http://www.census.gov/foreign-trade
Where the Toys are ... Made
563 The number of locations that primarily produced dolls, toys, and games in 2012; they employed 7,481 workers in the pay period including March 12.  California led the nation with 95 establishments. 
Source: U.S. Census Bureau, 2012 County Business Patterns
http://factfinder2.census.gov/bkmk/table/1.0/en/BP/2012/00A1//naics~33993
Holiday Names
Place names associated with the holiday season consist of a dozen places named Holly including Mount Holly, N.C. (population 13,904) and Holly Springs, Miss. (7,558). There is Snowflake, Ariz. (5,576), Santa Claus, Ind. (2,501), North Pole, Alaska (2,214),Noel, Mo. (1,809) and — if you know about reindeer — Dasher, Ga. (944) and Rudolph village, Wis. (436). There is also Unity, N.H.(1640), and Peace, N.D. (28). 
Source: U.S. Census Bureau, Population Estimates
http://www.census.gov/popest/data/cities/totals/2013/SUB-EST2013-3.html
Thanksgiving, Hanukkah and Kwanzaa
52.3% Estimated proportion of the nation's potatoes produced in Idaho and Washington during the fall of 2013. Potatoes are a popular dish served during the holidays.   
Source: National Agriculture Statistics Service, Page 2
http://www.nass.usda.gov/Statistics_by_State/Washington/Publications/Current_News_Release/PT09_1.pdf
$1.6 billion The estimated value of product shipments of candles in 2012 by U.S. manufacturers. Many of these candles are lit during Diwali (Oct. 23), Hanukkah (Dec. 16-24) and Kwanzaa (Dec. 26-Jan. 1) celebrations. 
Source: U.S. Census Bureau, 2012 Economic Census, Industry Serieshttp://factfinder2.census.gov/bkmk/table/1.0/en/ECN/2012_US/31I2//prodsvc~3399995
Nearly 450 million to 470 millionPackages of mail the U.S. Postal Service expects to deliver between Nov. 17 and Christmas Day. This is a 12 percent increase from last year.
Source: U.S. Postal Service
http://about.usps.com/news/national-releases/2014/pr14_057.htm
Following is a list of observances typically covered by the Census Bureau's Facts for Features series:
African-American History Month (February)
Labor Day
Super Bowl 
Grandparents Day
Valentine's Day (Feb. 14) 
Hispanic Heritage Month (Sept. 15-Oct. 15)
Women's History Month (March) 
Unmarried and Single Americans Week
Irish-American Heritage Month (March)/ 
Halloween (Oct. 31)
St. Patrick's Day (March 17) 
American Indian/Alaska Native Heritage Month
Earth Day (April 22) 
(November) 
Asian/Pacific American Heritage Month (May) 
Veterans Day (Nov. 11)      
Older Americans Month (May) 
Thanksgiving Day                                              
Mother's Day 
The Holiday Season (December)    
Hurricane Season Begins (June 1) 

Father's Day 

The Fourth of July (July 4) 

Anniversary of Americans with Disabilities Act (July 26) 

Back to School (August)