
Showing posts with label Fort Worth real estate. Show all posts
Showing posts with label Fort Worth real estate. Show all posts
Thursday, September 22, 2016

Friday, September 16, 2016
Is the Current Pace of Home Sales Sustainable?

There are some experts questioning whether the current pace of residential home sales is sustainable. Are too many people buying homes like in 2004-2006? Are we headed for another housing crisis? Actually, if we look closely at the numbers, we can see that we are looking at a very healthy real estate market.
Why the concern?
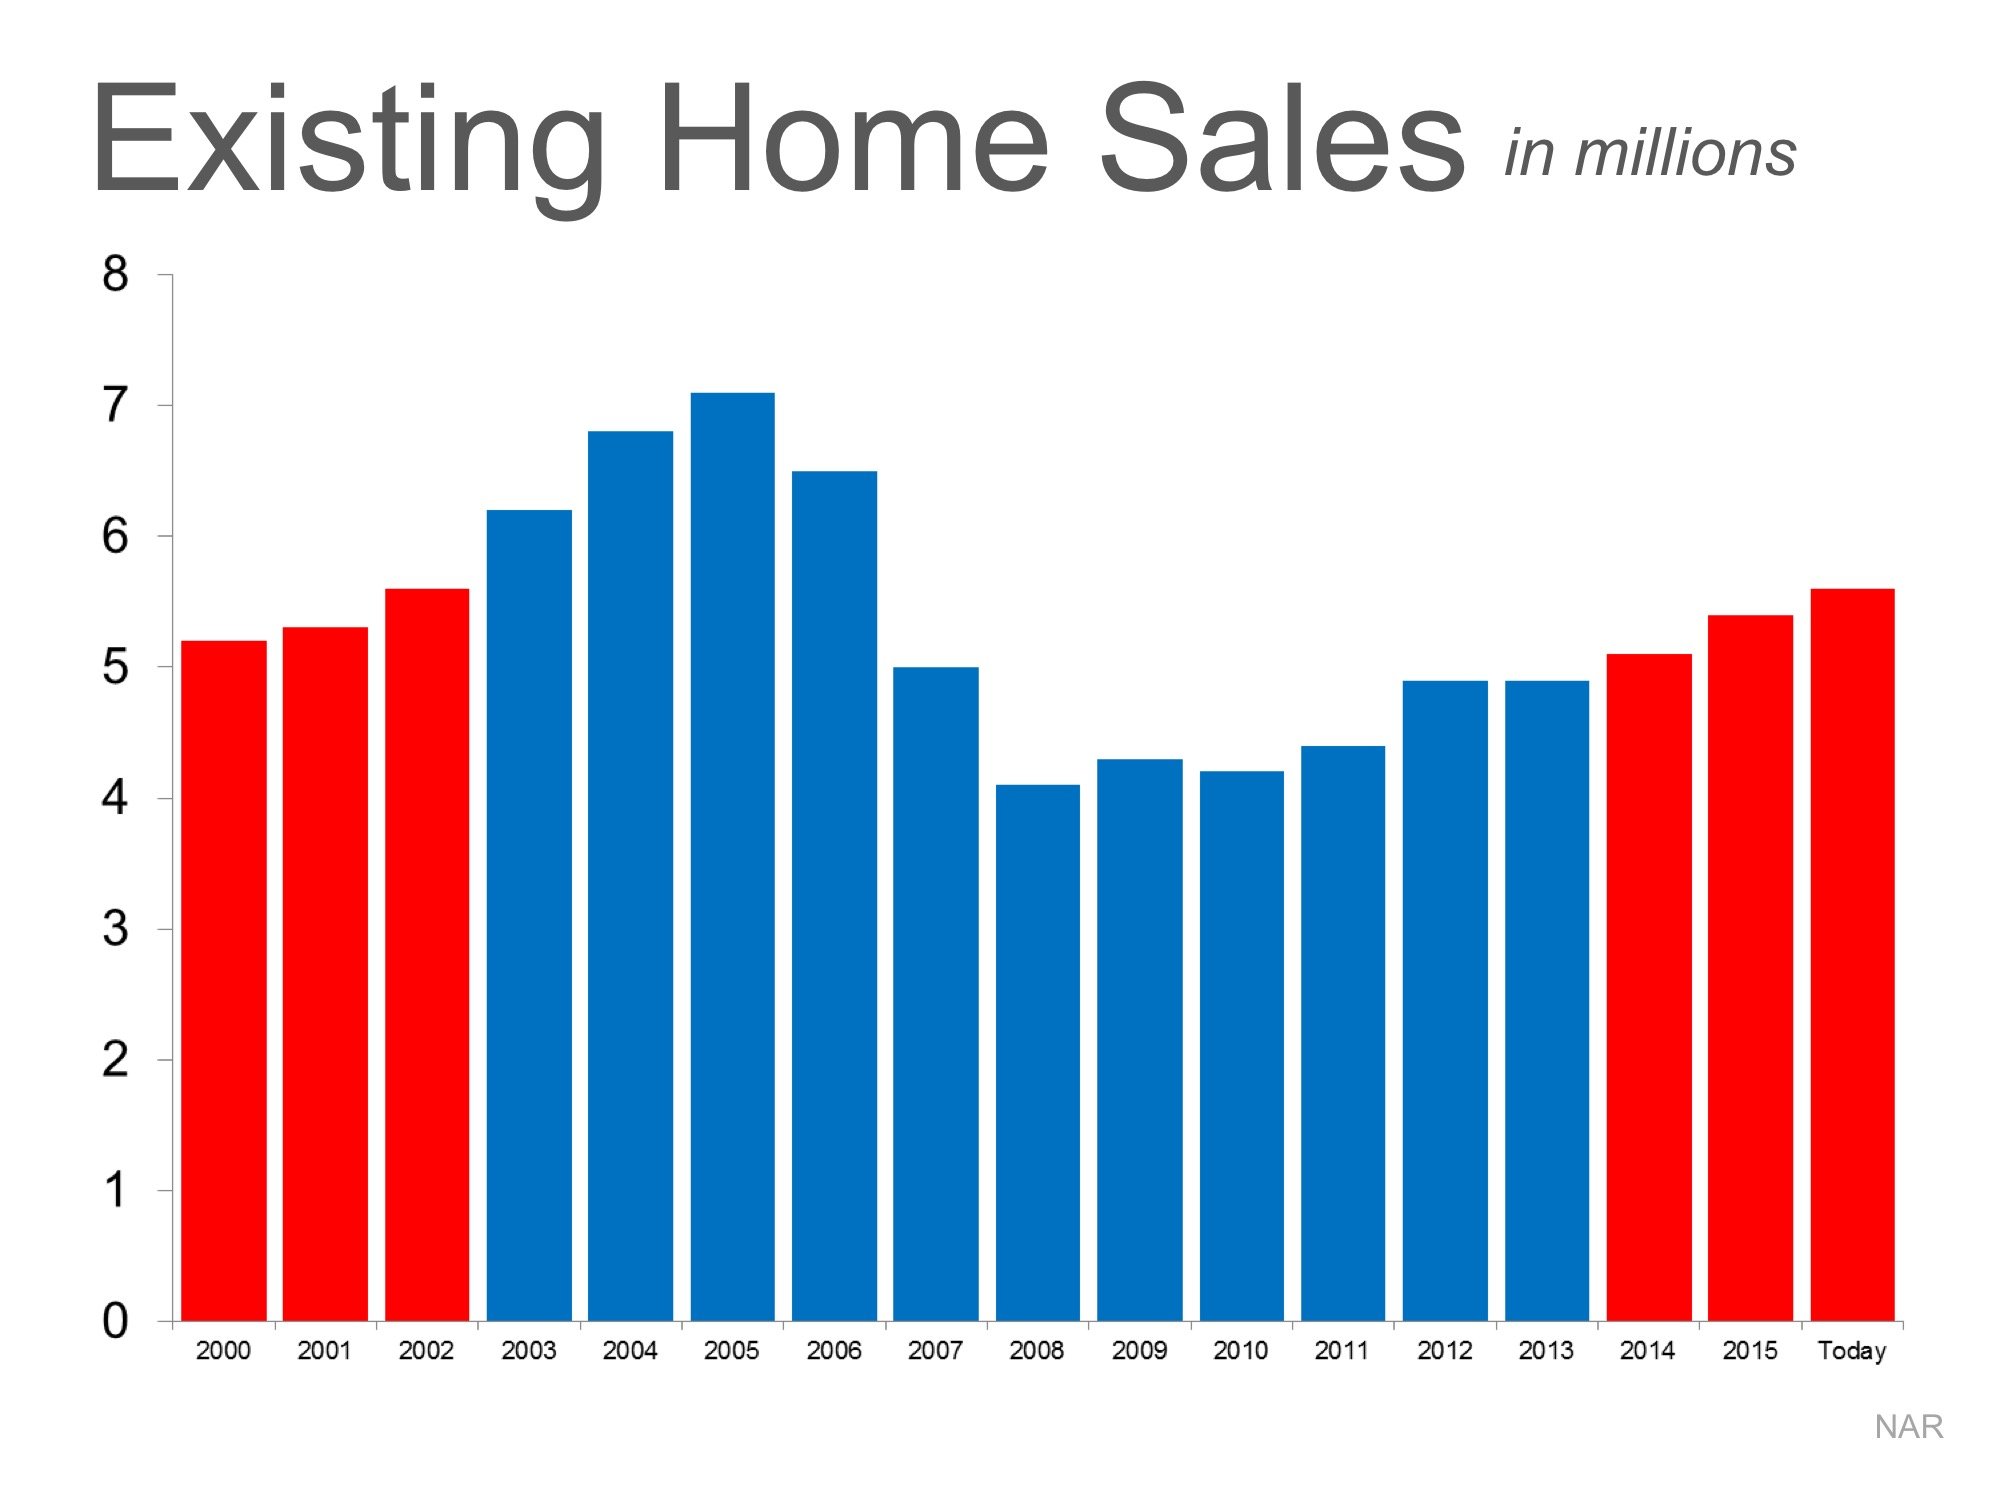
Some are looking at the last three years of home sales and comparing them to the three years just prior to the housing bubble. Looking at the graph below, we can understand that thinking.
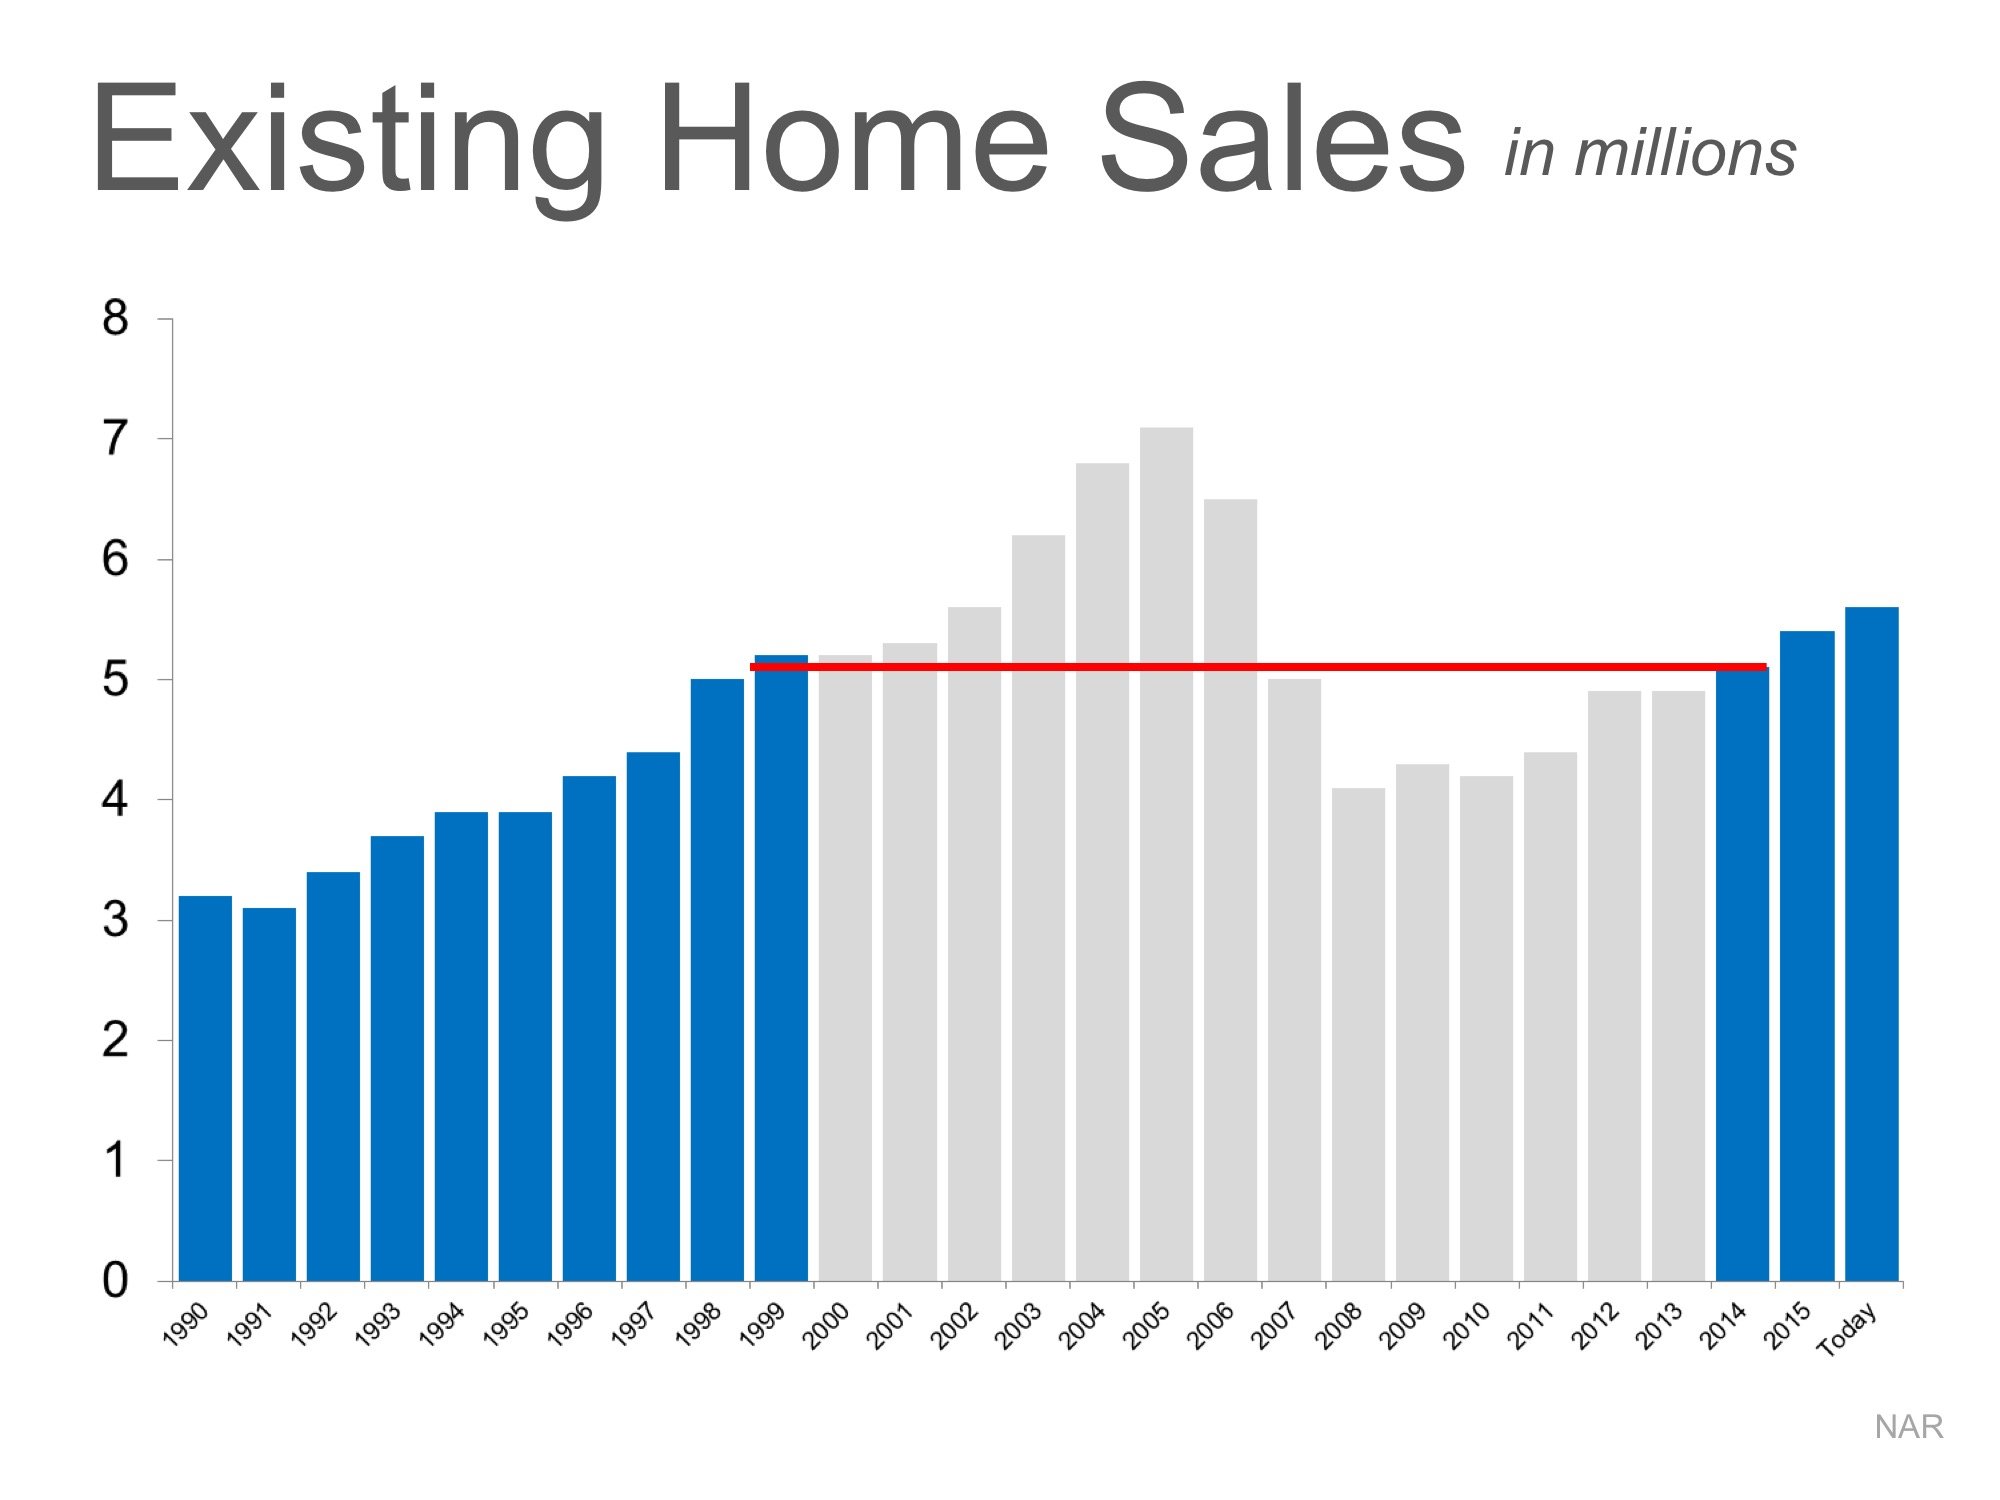
However, if we go further back in history, we can see the real picture. After taking out the “boom & bust” years, the pace of sales is growing at a quite natural pace.
And new home sales are way below historic numbers. Trulia’s Chief Economist Ralph McLaughlin explains:
“Adjusted for population, [new home sales] are at about 63% of their fifty-year average level—way better than 2011, but nowhere near heated.”
Bottom Line
The current pace of residential home sales definitely seems sustainable.
Saturday, July 16, 2016

Friday, June 17, 2016

Thursday, May 12, 2016

Monday, May 2, 2016
Texas home sales jump in first quarter of 2016, inventory drops to all-time low
Texas Association of Realtors releases 2016-Q1 edition of the Texas Quarterly Housing Report
Texas home sales rose significantly in the first quarter of 2016, while housing inventory fell to an all-time low, according to the 2016-Q1 Texas Quarterly Housing Report released today by the Texas Association of Realtors."Despite the economic downturn in some parts of the state, home sales continue to be strong, indicating the enduring demand of Texas real estate," said Leslie Rouda Smith, chairman of the Texas Association of Realtors. "Our state continues to be a hub for relocation activity, business development and job growth."
According to the report, 65,265 homes were sold in Texas in the first quarter of 2016, a 7.8 percent increase from the same quarter of 2015. Home prices continued to rise as well, with the median price for Texas homes increasing 5.4 percent year-over-year to $195,000.
Jim Gaines, Ph.D., economist with the Real Estate Center at Texas A&M University, added, "The Texas economy is experiencing a cooling off period after a five-year boom, so the Texas housing market's strong gains despite the current uneasiness in the state economy are remarkable. It will be interesting to see how Texas real estate activity performs in the next two quarters, typically the strongest quarters for home sales every year. That performance will show the full strength of the Texas housing market in 2016."
Housing inventory fell to an all-time low of 2.8 months in 2016-Q1, a decline of 0.6 months from the first quarter of 2015. The Real Estate Center at Texas A&M University estimates that a monthly housing inventory between 6.0 and 6.5 months is a level at which the supply and demand for homes is balanced.
Active listings also fell sharply in 2016-Q1, dropping 11.9 percent year-over-year to 74,276 active listings. Texas homes also continued to spend less time on the market. In 2016-Q1, Texas homes spent an average of 64 days on the market, a decrease of three days compared to the same quarter of the prior year.
Chairman Smith concluded, "Housing inventory remains extremely limited in Texas. Low housing inventory combined with rising property values is making housing affordability a challenge, not just in Texas's metro areas but across the state. This could become a larger problem if there is not greater balance between supply and demand in the future."
Thursday, April 14, 2016
Tuesday, March 22, 2016
Saturday, February 20, 2016

Thursday, January 21, 2016
Tuesday, January 12, 2016
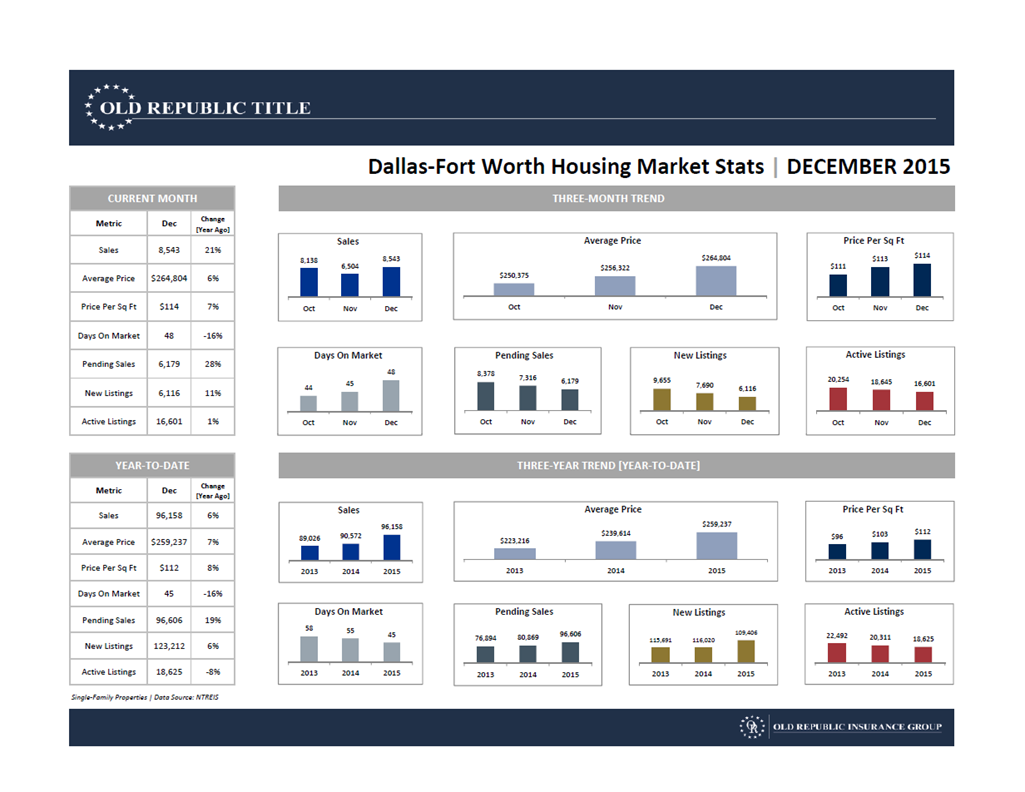
Today, Zillow® announced its predictions for the ten hottest housing markets in 2016. Topping the list is Denver, followed by Seattle and Dallas-Fort Worth, all of which are major tech towns – ideal for job growth. Other places that made the list are Utah markets Ogden and Salt Lake City, along with Omaha, Neb. and Boise, Idaho.
To determine which markets would be hot, Zillow looked at home value appreciation, low unemployment rates, and strong income growth. Omaha has the lowest unemployment rate of the ten hottest markets, at just 2.9 percent. Denver saw home values rise 16 percent in 2015, and Zillow is forecasting them to rise another 5 percent in 2016, along with Portland.
A strong and diverse economy is the driving force behind Richmond's high income growth, with government, finance, education, and manufacturing jobs robust in the area and expected to continue in 2016. Boise, Ogden, Salt Lake City and Sacramento all have high forecasted home value appreciation; homes are expected to appreciate an average of about five percent over the next year.
Zillow's Top 10 Housing Markets for 2016:
- Denver, Colo.
- Seattle, Wash.
- Dallas-Fort Worth, Texas
- Richmond, Va.
- Boise, Idaho
- Ogden, Utah
- Salt Lake City, Utah
- Omaha, Neb.
- Sacramento, Calif.
- Portland, Ore.
"Trendy tech centers like San Francisco, Seattle and Denver hogged the spotlight in 2015. But this year, the markets that shine brightest will be those that manage to strike a good balance between strong income growth, low unemployment and solid home value appreciation," said Zillow Chief Economist Dr. Svenja Gudell. "As the job market continues to hum and opportunity becomes more widespread, the best housing markets are no longer limited to the coasts or one-industry tech towns. This year's hottest markets have something for everyone, whether they're looking for somewhere to raise a family or start their career."
Three variables influenced Zillow's hot market predictions: Zillow's Home Value Forecasti, which forecasts the change in the Zillow Home Value Index over the next 12 months, recent income growthii, and current unemployment ratesiii. Those three variables were then scaled and combined to form a 'hotness score,' producing the top ten list.
Saturday, December 19, 2015

Friday, October 30, 2015
Existing Home Report for September
|
|
|

|

|

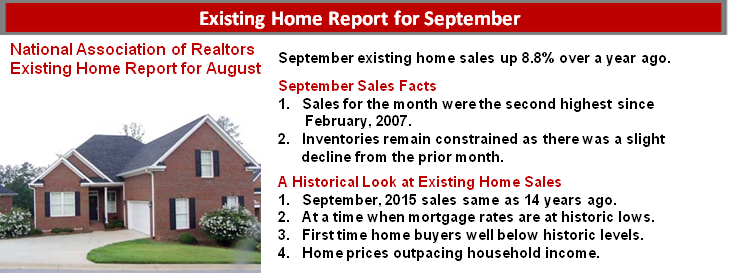
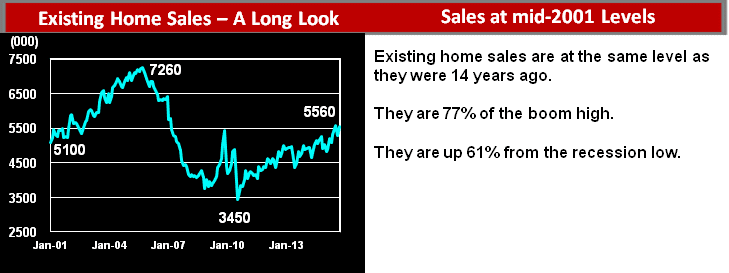
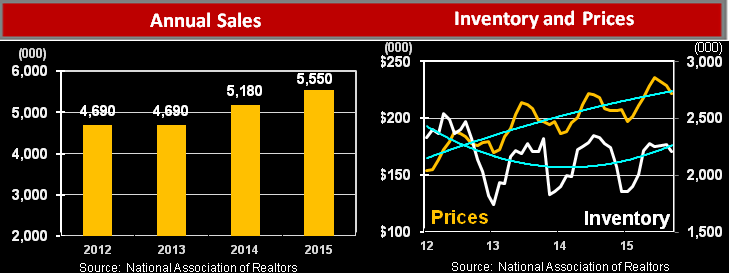
| Existing Homes Summary Not much change in inventory the last 2 years while sales are up 18% over the same 2 year period. The supply and demand changes have propelled existing home prices higher. |
|
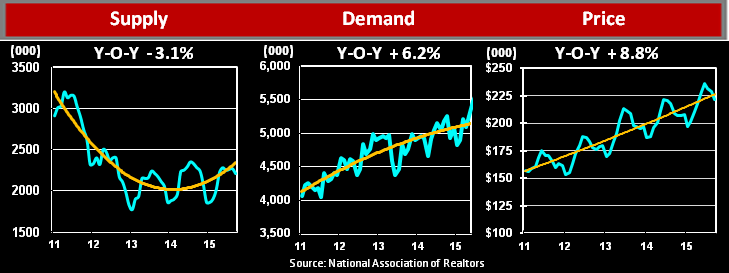
| Supply - Demand - Price Charts The inventory decline has slowed and sales are experiencing strong growth. Prices are surging. Months supply has stayed below 6 for nearly 3 years. |
|
|

Saturday, May 2, 2015
Texas real estate starts 2015 strong, housing inventory hits all-time low
Texas housing demand remained strong in the first quarter of 2015, with home sales posting unseasonal gains and housing inventory falling to an all-time low, according to the 2015-Q1 Texas Quarterly Housing Report released today by the Texas Association of Realtors.
"The first quarter of the year is typically a slow period for homebuying and selling, so we were thrilled to see strong home sales gains statewide in the first part of 2015," said Scott Kesner, chairman of the Texas Association of Realtors. "Market conditions are ripe for another competitive summer selling season in 2015. Texans looking to make a move this summer should begin working with a Texas Realtor now to prepare."
According to the 2015-Q1 Texas Quarterly Housing Report, 57,818 homes were sold in Texas in the first quarter of 2015, a 4.16 percent increase from the same quarter of 2014. This is a significant change from the first half of last year, when Texas home sales were essentially flat.
Monthly housing inventory continued to drop in the first three months of 2015, falling to a new all-time low of 3.1 months in 2015-Q1. This is a decrease of 8.82 percent from 2014-Q1 and is less than half the 6.5-month level that the Real Estate Center at Texas A&M University cites as a balanced housing market.
Jim Gaines, Ph.D., economist with the Real Estate Center at Texas A&M University, explained, "Homes are being built as quickly as possible, yet most are not in the price range where inventory is needed most – the entry-level market. Interest rates are still low, but tight lending standards, rising home prices and slim inventory have created a tough market for first-time homebuyers."
In 2015-Q1, the median price for Texas homes was $186,500, a 7.8 percent increase from 2014-Q1, and the average price increased 6.99 percent to $240,303. This year-over-year increase of 6 percent to 8 percent is nearly double Texas' historical increase of 4.1 percent annually.
Chairman Kesner concluded, "The demand for Texas real estate is still strong, but our state's housing market growth will not be sustainable if high homeownership costs, low housing inventory and unfunded transportation needs are allowed to continue. That's why state legislators are working on long-term solutions now that will provide much-needed transportation funding and tax relief toTexas homeowners. Texas Realtors applaud these efforts."
Gaines added additional caution: "The impact of falling oil prices has not yet hit Texas real estate, especially in its metro areas. Texashome sales could experience a slowdown in the last half of 2015 and, depending on when and at what level oil prices stabilize, end 2015 at a lower level than previous years."
About the Texas Quarterly Housing ReportData for the Texas Quarterly Housing Report is analyzed by the Real Estate Center at Texas A&M University using statistics compiled from multiple listing services in nearly 50 markets throughout Texas. The report includes data for single-family home sales over the course of one quarter and is scheduled for release by the Texas Association of Realtors on the following dates each year (or the next business day): Feb. 1, May 1, Aug. 1 and Nov. 1. To view the 2015-Q1 report in its entirety, visit TexasRealEstate.com.
About the Texas Association of REALTORS®With more than 95,000 members, the Texas Association of REALTORS® is a professional membership organization that represents all aspects of real estate in Texas. We advocate on behalf of Texas REALTORS® and private-property owners to keep homeownership affordable, protect private-property rights, and promote public policies that benefit homeowners. VisitTexasRealEstate.com to learn more.
Tuesday, December 23, 2014
Realtor.com® 2014 Housing Review: A Year of Jobs, Record-Low Interest and Tight Inventory Sets the Stage for 2015 Growth
This year demonstrated a steady build-up of housing momentum –fueled by significant improvements in economic fundamentals, low mortgage rates, and compressed inventory – and is expected to carry the market into 2015 gains, according to the 2014 Housing Review issued today by realtor.com®, a leading provider of online real estate services operated by News Corp subsidiary Move, Inc. This review includes the Top 10 Real Estate Trends that defined the 2014 housing market, as well as the Most-Searched Neighborhoods of the year.
"Many of the gains that we recently predicted in the realtor.com® 2015 Housing Forecast are built on housing growth established in 2014. Overall, this year's housing market showed steady advances over 2013 with significant improvement in key housing metrics, despite some remaining challenges," said Jonathan Smoke, chief economist for realtor.com®. "Increases in job creation and gross domestic product (GDP) have had a significant impact on consumer confidence and home buyer demand. Paired with historically low interest rates, these factors kept properties moving quickly with median time on market at approximately 90 days. Unfortunately, the low number of homes for sale and stringent lending standards prevented a normal number of first time home buyers from closing on their first home in 2014."
Realtor.com®'s Top 10 Real Estate Trends of 2014
Indicators demonstrating a stronger housing recovery:
- Improving economic fundamentals: After an especially harsh winter earlier in the year, the economy picked up steam and produced a banner year for new jobs. The GDP this year was higher, and is still trending higher, resulting in stronger consumer confidence.
- Historically low mortgage rates continued: Mortgage rates declined despite the end of quantitative easing this year. Global weakness, along with actions by the European Central Bank and similar central banks in Asia kept our Federal Reserve from raising the Federal Fund Rate, which kept mortgage rates low.
- Deceleration of abnormal home price gains or return to normal price appreciation: After two years of abnormally high levels of home price appreciation in 2012 and 2013, price increases moderated throughout 2014. We are now experiencing increases in home prices consistent with long-term historical performance.
- Decline of distressed sales: Foreclosures and short sales declined throughout the year, and while total home sales decreased year over year, normal (non-distressed) home sales increased over 2013 – due to the decline of the distressed sales market. Foreclosure inventories also fell substantially, and are forecasted to be down 30 percent year over year at the close of 2014.
- End of the era of major investors active in purchases: Related to the drop in distressed sales opportunities, and against backdrop of higher home prices, portfolios of single-family homes for rent potentially reached their peak earlier this year. Large-scale investor purchase activity in the single-family market sector continued to decline, enabling more room for traditional first-time buyers.
Factors holding back recovery:
- Tight credit standards and limited mortgage availability: Despite historically low rates, many households were prevented from capitalizing on mortgage access because of overlays lenders added to qualification standards in order to limit put-back risk. A tight spread between approved and declined FICO Scores shut out nearly half of the potential population this year. As a result, mortgage credit availability did not improve in 2014.
- Tight supply of inventory: While absolute inventories increased as the year progressed, supply did not outpace demand. Monthly supply of new homes and existing homes remained beneath normal levels, and the age of inventory was down year over year.
- Depressed levels of first-time buyers: The share of first-time buyers fell to the lowest level in over twenty years according to the National Association of Realtors. "But the first-time buyer share is showing signs of modest improvement by the year-end," said Lawrence Yun, NAR Chief Economist. Federal policy actions, such as revised regulations for lenders and new low down-payment programs introduced in December are anticipated to have a positive impact in 2015.
- Record levels of renters and ever-increasing rent prices: Continued declines in homeownership rates resulted in record numbers of renting households. Rent increases became an inflationary concern this year, and looking ahead, the pace of these increases are not slowing down.
- Lack of recovery in homebuilding and low share of new home sales: Single-family starts barely increased in 2014 over 2013. New home sales remain far from normal share levels – typically near 16 percent, now instead around 9 percent. New home prices increased substantially again this year, revealing that higher priced product is limiting the demand.
"In 2014, we also saw some neighborhoods stand out from the pack, eliciting the most searches on realtor.com® for the entire year. The hyper-local markets on this list demonstrate the wonderful diversity of real estate demand across the country," Smoke said. "Median list prices in these most-searched neighborhoods are near $400,000, well above national median of $214,000, as well as their respective metro medians. Homes in these communities are moving quickly as the aggregated median age for the group is almost half of the national median of 90 days."
Realtor.com®'s Most-Searched Neighborhoods in 2014
Rankings are based on realtor.com® search and unique visitor statistics at ZIP level from January to November 2014 (desktop only, excludes mobile and web apps). Figures are adjusted relative to housing stock. Ranked ZIPs have a minimum of 5,000 listings.
Supporting Resources
Subscribe to:
Posts (Atom)