Showing posts with label home ownership. Show all posts

Friday, July 1, 2016

Realtors® to Congress: Flood Insurance Rates Pose Threat to Business, Homeownership

Flood insurance costs continue to put small businesses and homeownership at risk, but the National Association of Realtors® told U.S. Senators today that a range of solutions are on the horizon.
David McKey, 2016 vice chair of NAR's Insurance Committee, testified on NAR's behalf before the Senate Small Business and Entrepreneurship committee. McKey told Senators in attendance that Realtors® continue to report that their clients face significant hurdles due to excessive flood insurance costs and future uncertainty.
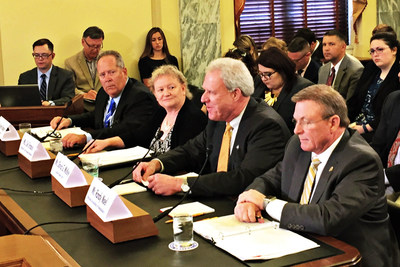
"Despite everything that's been done on this issue, the threat of a$30,000 flood insurance premium still looms," said McKey. "A few years ago, the uncertainty over future rate increases was enough for buyers to direct Realtors® not to show them any listings in the floodplain. That's enough to worry business owners and homeowners alike, and it's something that needs to be addressed."
In his testimony, McKey praised the "Homeowner Flood Insurance Affordability Act," which became law in 2014 and reined in the most inaccurate rate increases across the country. Before the Affordability Act, thousands of small business owners faced immediate and excessive rate increases under FEMA's implementation of the "Biggert Waters Flood Insurance Reform Act of 2012."
But McKey warned the committee that significant concerns still remain. He noted that even now, rates continue to rise exponentially by 25 percent each year until policy-holders reach their "full-cost rate."
For a business or a homeowner to prove that they've reached the full-cost rate, they must hire a licensed surveyor and provide FEMA with a costly elevation certificate. If the certificate shows that the property owner has already reached full cost, the owner may request an optional full-risk rating to end the 25 percent increases. Otherwise, the increases continue.
This creates what McKey described as an "endless escalator" of rising costs for businesses and homeowners.
Although it isn't possible to determine how many properties will ultimately be affected, current estimates show that roughly 1 million properties have subsidized insurance rates that may be subject to significant increases.
McKey reiterated NAR's support for a range of solutions to address the problem, including:
  • Reauthorizing the National Flood Insurance Program, which sunsets in October 2017;
  • Using advanced technology to improve the accuracy of flood maps to provide the data needed to determine how many face unaffordable rates and also reduce the number of property owners who have to file expensive appeals; and
  • Fostering a private insurance market to complement the NFIP.  
Additionally, McKey suggested an NAR-backed strategy for actually preventing flood damage. By authorizing the use of funds to proactively mitigate properties located in hazard areas, McKey noted that it's possible to protect property owners while saving taxpayers' money. This might include flood proofing, elevating, or otherwise strengthening a property.
Unfortunately, while funding is currently available for mitigation efforts, funds typically aren't accessible until after a flood event, when costs are higher and the damage has already occurred.
"Realtors® see the effect of rising flood insurance rates firsthand in their businesses and in the local communities," McKey said. "But commonsense solutions to the problem are well within reach. NAR is thankful for the opportunity to testify and applauds the Committee's attention to this important issue."  
David McKey is the managing broker/owner of Coldwell Banker One in Baton Rouge, Louisiana, and was the 2013 president of the Louisiana Realtors® Association.
The National Association of Realtors®, "The Voice for Real Estate," is America's largest trade association, representing 1.1 million members involved in all aspects of the residential and commercial real estate industries.

Friday, March 25, 2016

CoreLogic Reports 1 Million US Borrowers Regained Equity in 2015

CoreLogic® (NYSE: CLGX), a leading global property information, analytics and data-enabled services provider, today released a new analysis showing 1 million borrowers regained equity in 2015, bringing the total number of mortgaged residential properties with equity at the end of Q4 2015 to approximately 46.3 million, or 91.5 percent of all mortgaged properties. Nationwide, borrower equity increased year over year by $682 billion in Q4 2015. The CoreLogic analysis also indicates approximately 120,000 properties lost equity in the fourth quarter of 2015 compared to the third quarter of 2015.
The total number of mortgaged residential properties with negative equity stood at 4.3 million, or 8.5 percent, in Q4 2015. This is an increase of 2.9 percent quarter over quarter from 4.2 million homes, or 8.3 percent, inQ3 2015* and a decrease of 19.1 percent year over year from 5.3 million homes, or 10.7 percent, compared with Q4 2014.
Negative equity, often referred to as “underwater” or “upside down,” applies to borrowers who owe more on their mortgages than their homes are worth. Negative equity can occur because of a decline in home value, an increase in mortgage debt or a combination of both.
For the homes in negative equity status, the national aggregate value of negative equity was $311 billion at the end of Q4 2015, increasing approximately $5.5 billion, or 1.8 percent, from $305.5 billion in Q3 2015. On a year-over-year basis, the value of negative equity declined overall from $348 billion in Q4 2014, representing a decrease of 10.7 percent in 12 months.
Of the more than 50 million residential properties with a mortgage, approximately 9.5 million, or 18.9 percent, have less than 20 percent equity (referred to as “under-equitied”) and 1.2 million, or 2.3 percent, have less than 5 percent equity (referred to as near-negative equity). Borrowers who are under-equitied may have a difficult time refinancing their existing homes or obtaining new financing to sell and buy another home due to underwriting constraints. Borrowers with near-negative equity are considered at risk of moving into negative equity if home prices fall.
“In Q4 of last year home equity increased by $680 billion or 11.5 percent, the 13th consecutive quarter of double digit growth,” said Frank Nothaft, chief economist for CoreLogic. “The improvement in equity reflects positive home prices and continued deleveraging of mortgage balances by households.”
“The number of homeowners with more than 20 percent equity is rising rapidly,” said Anand Nallathambi, president and CEO of CoreLogic. “Higher prices driven largely by tight supply are certainly a big reason for the rise, but continued population growth, household formation and ultralow interest rates are also factors. Looking ahead in 2016, we expect home equity levels to continue to build, which is a good thing for the long-term health of the U.S. economy.”
Highlights as of Q4 2015:
  • Nevada had the highest percentage of mortgaged residential properties in negative equity at 18.7 percent, followed by Florida (17.1 percent), Illinois (14.6 percent), Arizona (14 percent), and Rhode Island (13.5 percent). These top five states combined account for 30.8 percent of negative equity in the U.S., but only 16.5 percent of outstanding mortgages.
  • Texas had the highest percentage of mortgaged residential properties in positive equity at 98 percent, followed by Alaska (97.6 percent), Hawaii (97.6 percent), Montana (97.3 percent) and Colorado (97.1 percent).
  • Of the selected 10 metropolitan areas, Miami-Miami Beach-Kendall, FL had the highest percentage of mortgaged properties in negative equity at 22 percent, followed by Las Vegas-Henderson-Paradise, NV (21.3 percent), Chicago-Naperville-Arlington Heights, IL (16.7 percent), Washington-Arlington-Alexandria, DC-VA-MD-WV (11 percent) and Boston, MA (6.3 percent).
  • Of the same 10 metropolitan areas, San Francisco-Redwood City-South San Francisco, CA had the highest percentage of mortgaged properties in a positive equity position at 99.3 percent, followed by Houston-The Woodlands-Sugar Land, TX (98.1 percent), Denver-Aurora-Lakewood, CO (98 percent), Los Angeles-Long Beach-Glendale, CA (95.5 percent) and New York-Jersey City-White Plains, NY-NJ (93.8 percent).
  • Of the total $311 billion in negative equity nationally, first liens without home equity loans accounted for $171 billion, or 55 percent, in aggregate negative equity, while first liens with home equity loans accounted for $140 billion, or 45 percent.
  • Approximately 2.6 million underwater borrowers hold first liens without home equity loans. The average mortgage balance for this group of borrowers is $240,000 and the average underwater amount is $65,000.
  • Approximately 1.7 million underwater borrowers hold both first and second liens. The average mortgage balance for this group of borrowers is $304,000 and the average underwater amount is $82,000.
  • The bulk of positive equity for mortgaged residential properties is concentrated at the high end of the housing market. For example, 95 percent of homes valued at $200,000 or more have equity compared with 87 percent of homes valued at less than $200,000.
*Q3 2015 data was revised. Revisions with public records data are standard, and to ensure accuracy, CoreLogic incorporates the newly released public data to provide updated results.

Wednesday, March 16, 2016

Millennials and Non-White Americans Most Likely to Associate Homeownership with the American Dream

Millennials and their grandparents are most likely to associate homeownership with the American Dream, and people of color are more likely than white people to connect the two, according to the latest Zillow® Housing Confidence Index (ZHCI).

- Among people of various races, Hispanic survey respondents most associate homeownership with the American Dream, at 70 percent.

- Among people of different generations, millennials are most likely to associate the two, at 65 percent.

- Despite the association, fewer millennial renters -- 46 percent -- expressed confidence they would be able to afford a home, compared to six months ago, when 50 percent did.


Millennials and people of color are most likely to associate homeownership with the American Dream, according to the latest Zillow® Housing Confidence Index (ZHCI)i.
Among people 18-34 years old, 65 percent said homeownership and the American Dream go hand-in-hand. That's more than any other generation. Similar to millennials, 64 percent of respondents age 65 and older said homeownership is necessary for the good life and the American Dream.
People-of-color also were more likely than white people to consider homeownership integral to the American Dream. Of Hispanic respondents surveyed, 70 percent agreed that owning their own home is necessary to live the American Dream, followed by 64 percent of Asian respondents and 63 percent of black respondents. Almost 60 percent of white respondents agreed.
The survey results come at a time when rising rents and stagnant incomes are making it tough for many Americans to buy homes. Millennials are renting longer than past generations as they put off major life decisions, but Zillow's survey shows millennials value homeownership more than their parents and grandparents.
The rising confidence of millennials and Hispanics, in particular, are helping to drive rising overall confidence in the housing market. Confidence in the housing market overall has increased from six months ago, to a headline index of 66.9. An index number over 50 indicates general confidence.
With their faith in the value of homeownership and their optimism in the market, these groups will play a key role in ensuring the stability of the market as demographics change. For example, millennial households have more confidence in the housing market compared to the general population, and expect home values to appreciate 5 percent annually over the next 10 years.
"The American Dream is really about opportunity, which means a lot of things to a lot of different people. For young Americans and Americans of color, the opportunity to own a home is a big part of that dream," said Zillow Chief Economist Dr. Svenja Gudell. "It's often assumed that homeownership holds little interest for these groups, or that they may feel the challenges in achieving homeownership aren't worth the benefits. But that's simply not true, and their optimism and determination today will be hugely important to the stability and growth of the housing market tomorrow. These Americans represent the next generation of U.S. homeowners, and for homeownership to eventually become a reality, it has to start as a dream."
The semi-annual U.S. Housing Confidence Survey (HCS), sponsored by Zillow and conducted by Pulsenomics LLC, asks 10,000 renters and homeowners about the condition of their local real estate market, their expectations for home value growth and affordability in the future, and their views on homeownership.
"Amidst turbulent financial markets and unsettling election year politics, confidence in the U.S. housing market has proven resilient in recent months, even as investor confidence, business confidence, and consumer economic sentiment have wavered," said Terry Loebs, Founder of Pulsenomics. "Housing confidence has increased in every metro area surveyed over the past two years and fueled the market recovery. This is reassuring in the face of economic and financial market headwinds."   
Metropolitan Area
Hispanic
Respondents
Who Agreeii
Asian 
Respondents
Who Agree
Black 
Respondents
Who Agree
White
Respondents 
Who Agree
United States
69.7%
63.7%
62.9%
57.6%
New York/Northern New Jersey
74.3%
60.3%
59.3%
57.4%
Los Angeles-Long Beach-Anaheim, CA
75.0%
67.8%
67.7%
64.2%
Chicago, IL
76.4%
82.9%
63.4%
61.2%
Dallas-Fort Worth, TX
61.0%
66.7%
72.2%
62.2%
Philadelphia, PA
66.7%
71.9%
56.3%
54.9%
Washington, DC
61.9%
60.3%
60.5%
57.0%
Miami-Fort Lauderdale, FL
75.4%
66.7%
62.2%
64.3%
Atlanta, GA
66.7%
78.8%
65.6%
52.0%
Boston, MA
74.4%
68.9%
67.7%
61.8%
San Francisco, CA
66.3%
61.3%
72.5%
47.8%
Detroit, MI
87.5%
62.5%
62.0%
62.8%
Phoenix, AZ
69.9%
51.5%
72.7%
58.6%
Seattle, WA
70.3%
59.3%
52.0%
54.6%
Minneapolis-St Paul, MN
9.1%
42.9%
77.4%
53.9%
San Diego, CA
57.6%
54.8%
58.3%
57.2%
St. Louis, MO
45.5%
70.6%
57.6%
55.7%
Tampa, FL
69.4%
50.0%
60.0%
59.1%
Denver, CO
72.6%
65.5%
53.8%
53.4%
Las Vegas, NV
79.0%
61.9%
65.3%
59.5%
San Jose, CA
69.9%
69.6%
58.3%
57.7%

Metropolitan Area
18-34 Year
Olds Who
Agree
35-49 Year
Olds Who
Agree
50-64 Year
Olds Who 
Agree
65+ Year
Olds Who 
Agree
United States
65.3%
58.4%
56.9%
63.9%
New York/Northern New Jersey
72.5%
71.0%
44.8%
54.7%
Los Angeles-Long Beach-Anaheim, CA
86.9%
57.7%
62.0%
64.4%
Chicago, IL
69.2%
62.8%
64.3%
66.7%
Dallas-Fort Worth, TX
71.4%
56.6%
59.7%
67.8%
Philadelphia, PA
44.0%
64.6%
56.3%
69.4%
Washington, DC
62.9%
54.8%
55.0%
65.2%
Miami-Fort Lauderdale, FL
73.0%
66.9%
68.0%
65.3%
Atlanta, GA
59.6%
59.0%
57.4%
62.9%
Boston, MA
74.2%
60.8%
54.5%
63.9%
San Francisco, CA
64.5%
53.7%
50.0%
60.0%
Detroit, MI
71.2%
58.7%
58.1%
67.0%
Phoenix, AZ
78.7%
37.0%
62.2%
63.4%
Seattle, WA
56.0%
57.4%
52.8%
61.4%
Minneapolis-St Paul, MN
55.9%
43.7%
54.5%
59.7%
San Diego, CA
54.1%
58.1%
53.8%
67.6%
St. Louis, MO
60.1%
50.0%
53.6%
61.4%
Tampa, FL
55.3%
64.7%
57.2%
65.4%
Denver, CO
57.8%
55.1%
56.8%
64.2%
Las Vegas, NV
70.4%
65.1%
60.0%
63.5%
San Jose, CA
66.2%
70.1%
58.3%
65.3%