Thursday, February 7, 2013

Love Is In The Air! Romance and Engagement Survey Tells All!

Who's more romantic? Should the woman propose? When do I change my Facebook relationship status? How much money to spend? Are "Man-gagement" rings legit?

The questions are endless when it comes to love, romance and engagements; and yes, men and women have different perspectives. As we enter February, the second most popular month to propose marriage (after December), Steve Elliott Marketing Research conducted an online survey for Robbins Brothers to gauge trends and preferences for dating and popping the question. 

Here are some interesting facts to consider during the "season of love": 
  • Long gone are the days of women waiting for men to propose marriage, and according to the survey, 30% of women and over 40% of men think it's perfectly okay for women to pop the question instead. 
  • What really makes the engagement official? 80% say the ring seals the deal. 
  • Men need love too. Over 60% want to be told and shown that they are loved. More than twice as many men as women want to be told daily. 
  • Over half of men admit to getting married for good ole fashion love as opposed to sex, social pressure, good health and family. 
  • Social Media clearly plays an important role in one's engagement announcement. Half of respondents say they would update their Facebook status right away after a proposal. 75% say within a week. 
  • Think engagement rings for men are ridiculous? Definitely reconsider. Two-thirds of men are open to the idea of wearing one. 
  • Contemplating how to execute the perfect proposal? Over half of respondents would accept an electronic proposal but nearly 75% prefer a quiet intimate dinner for two as the ideal setting. 
  • Romance is still the main desired ingredient in a marriage proposal. One out of every three wishes their proposal could have been more fanciful. 
  • Living in a world where reality shows rule the tube, 2 out of every 3 surveyed said they would allow their proposal to be recorded and posted on YouTube. In fact, one out of every 10 would actually propose via YouTube. 
  • More men than women think the marriage proposal needs to be a surprise. 
  • At the end of the day, Love conquers all. Even with a weak economy, getting married and buying a home are still considered a priority amongst half of respondents. 
PR Newswire (http://s.tt/1z6gt)


Wednesday, February 6, 2013

CoreLogic Home Price Index Rises for the 10th Consecutive Month in December; Biggest Year-Over-Year Increase Since May 2006

Irvine, Calif., February 5, 2013 — CoreLogic® (NYSE: CLGX), a leading residential property information, analytics and services provider, today released its December CoreLogic HPI® report. Home prices nationwide, including distressed sales, increased on a year-over-year basis by 8.3 percent in December 2012 compared to December 2011. This change represents the biggest increase since May 2006 and the 10th consecutive monthly increase in home prices nationally. On a month-over-month basis, including distressed sales, home prices increased by 0.4 percent in December 2012 compared to November 2012*. The HPI analysis shows that all but four states are experiencing year-over-year price gains.

Excluding distressed sales, home prices increased on a year-over-year basis by 7.5 percent in December 2012 compared to December 2011. On a month-over-month basis, excluding distressed sales, home prices increased 0.9 percent in December 2012 compared to November 2012. Distressed sales include short sales and real estate owned (REO) transactions.

The CoreLogic Pending HPI indicates that January 2013 home prices, including distressed sales, are expected to rise by 7.9 percent on a year-over-year basis from January 2012 and fall by 1 percent on a month-over-month basis from December 2012, reflecting a seasonal winter slowdown. Excluding distressed sales, January 2013 house prices are poised to rise 8.6 percent year over year from January 2012 and by 0.7 percent month over month from December 2012. The CoreLogic Pending HPI is a proprietary and exclusive metric that provides the most current indication of trends in home prices. It is based on Multiple Listing Service (MLS) data that measure price changes for the most recent month.

“December marked 10 consecutive months of year-over-year home price improvements, and the strongest growth since the height of the last housing boom more than six years ago,” said Mark Fleming, chief economist for CoreLogic. “We expect price growth to continue in January as our Pending HPIshows strong year-over-year appreciation.”

“We are heading into 2013 with home prices on the rebound,” said Anand Nallathambi, president and CEO of CoreLogic. “The upward trend in home prices in 2012 was broad based with 46 of 50 states registering gains for the year. All signals point to a continued improvement in the fundamentals underpinning the U.S. housing market recovery.”Highlights as of December 2012:


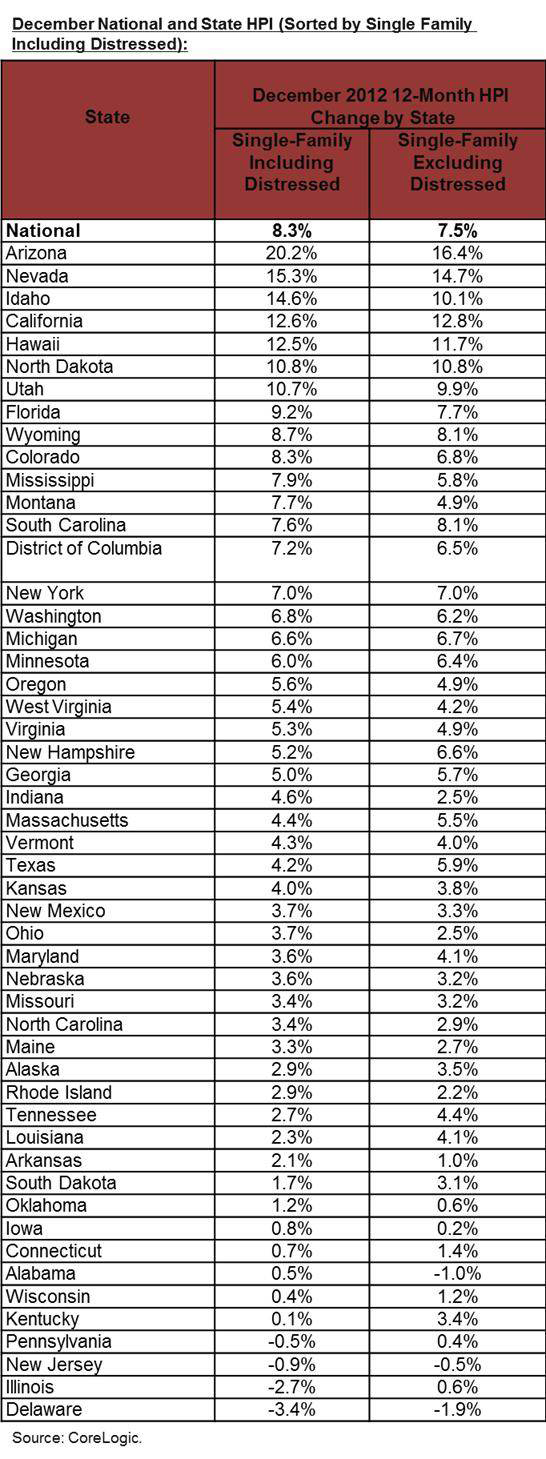
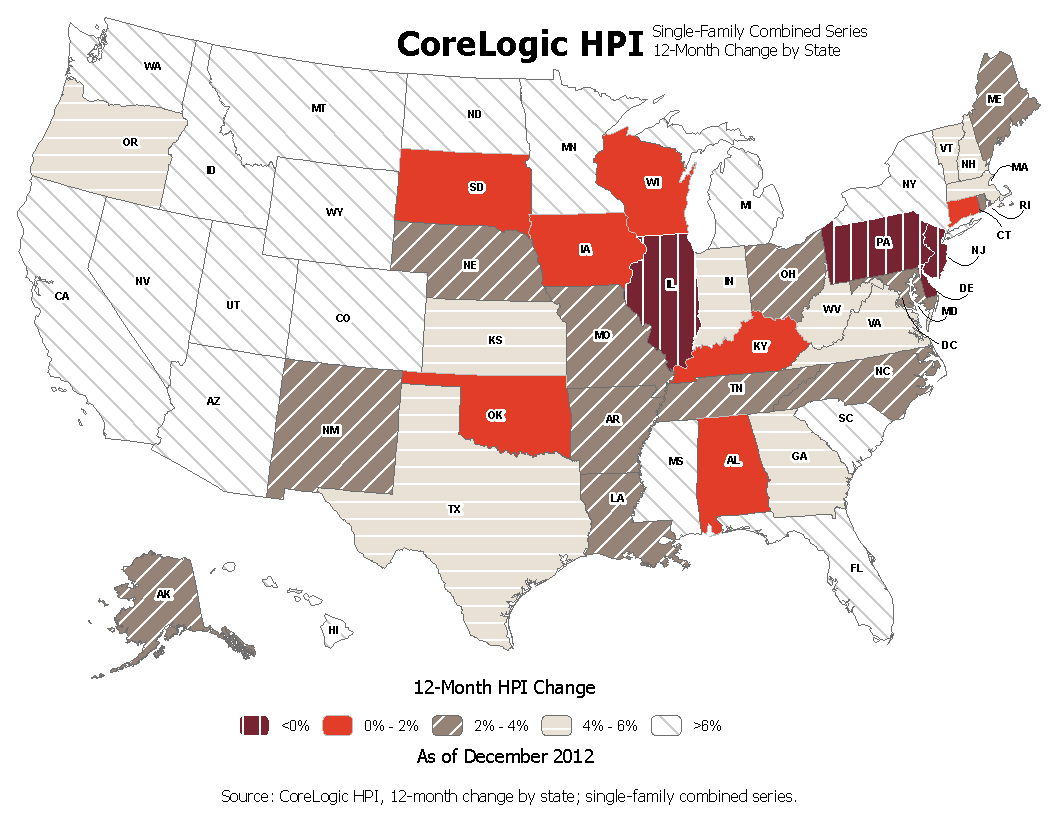
Including distressed sales, the five states with the highest home priceappreciation were: Arizona (20.2 percent), Nevada (15.3 percent), Idaho (14.6 percent), California (12.6 percent) and Hawaii (+12.5 percent).
Including distressed sales, this month only four states posted home pricedepreciation: Delaware (-3.4 percent), Illinois (-2.7 percent), New Jersey (-0.9 percent) and Pennsylvania (-0.5 percent).
Excluding distressed sales, the five states with the highest home priceappreciation were: Arizona (16.4 percent), Nevada (14.7 percent), California (12.8 percent), Hawaii (11.7 percent) and North Dakota (+10.8 percent).
Excluding distressed sales, this month only three states posted home pricedepreciation: Delaware (-1.9 percent), Alabama (-1.0 percent) and New Jersey (-0.5 percent).
Including distressed transactions, the peak-to-current change in the national HPI (from April 2006 to December 2012) was -26.9 percent. Excluding distressed transactions, the peak-to-current change in the HPI for the same period was -20.8 percent.
The five states with the largest peak-to-current declines, including distressed transactions, were Nevada (-52.4 percent), Florida (-43.5 percent), Arizona (-39.8 percent), Michigan (-36.5 percent) and California (-35.4 percent).
Of the top 100 Core Based Statistical Areas (CBSAs) measured by population, only 16 are showing year-over-year declines in December, two fewer than in November.


*November data was revised. Revisions with public records data are standard, and to ensure accuracy, CoreLogic incorporates the newly released public data to provide updated results.


Table 1: December HPI for the Country’s Largest CBSAs by Population (Sorted by Single Family Including Distressed)

Table 2: December National and State HPI (Sorted by Single Family Including Distressed)

Figure 1: Home Price Index
Percentage Change Year-Over-Year


OpenTable Survey Reveals Valentine's Day Dining Trends

According to a new survey released today by OpenTable (NASDAQ: OPEN), the world's leading provider of online restaurant reservations, restaurants are poised to be busy with diners celebrating love not only on Thursday, February 14, but on the weekend following Valentine's Day. OpenTable diners also indicated that they plan to celebrate love in a big way with a projected check average of $139, which is 63 percent more than the typical OpenTable check average of $85 per couple. The survey results also provided a peek into dating habits and trends related to the busiest holiday for dining out.

"The idea of a romantic Valentine's Day meal often conjures up images of lavish tasting menus, enchanting small plates, and prix fixe menus," said Caroline Potter , Chief Dining Officer of OpenTable. "However, our survey revealed some surprising insights into how people want to celebrate Valentine's Day and an indication of romantic trends to come. Diners prefer a la carte ordering in a classic three-course meal where they can personalize their experience."

Long Weekend of Love
  • 51 percent of respondents said they plan to dine out on the Thursday, February 14, while 36 percent said they plan to celebrate Valentine's Day on Friday, February 15, or Saturday, February 16.
  • 5 percent of diners said they plan to celebrate on Wednesday, February 13.
  • 8 percent of respondents plan on dining out more than once for Valentine's Day.
Positive Reviews and Ambiance Matter Most
  • Respondents indicated that the top three factors in selecting a restaurant for Valentine's Day are positive reviews (34%), romantic ambience (27 %) and service (16%).
  • Less important attributes included restaurant location (14%), special Valentine's Day menus (8%) and the quality of the wine list (1%).
Most Desirable Menus
  • When presented with menu options, diners said they prefer A la Carte (67%) over Prix Fixe (33%) menus.
  • Traditional menus came out on top with the majority of diners (56%) saying they would select a classic three-course meal (starter, entrĂ©e, and dessert).
  • Others preferred sharing several small plates (23%), feasting only on entrees (13%) or enjoying an extensive menu (8%).
Romance and Restaurants Go Hand in Hand
  • 21 percent of diners said they would go on a first date on Valentine's Day, while 42 percent said that Valentine's Day dining is reserved for those dating for a month or two.
  • The remaining 37 percent of respondents think that dining on the most romantic day of the year should be reserved for those who have been dating at least 3 months.
  • 71 percent of diners said that only some PDA is appropriate on the most romantic day of the year, while 21 percent think Valentine's Day is all about the PDA. Still, 8 percent said that PDA in a restaurant is never appropriate.
Check, Please!
  • Put your phone away! 56 percent of women and 61 percent of men say talking and texting at the table is the biggest dining faux pas a date can commit.
  • Being rude to wait staff was the second biggest no-no for 32 percent of women and 28 percent of men.
PR Newswire (http://s.tt/1zlhM)

Tuesday, February 5, 2013

Questions to Ask When Shopping for a Home Warranty


When you buy a pre-existing home, you want to make sure that your Realtor negotiates into the contract a residential service contract (RSC), also known as a home warranty.For home buyers, that means that don’t have to worry if something goes wrong. For the seller, that means that they don’t have to worry about surprises haunting them once they’ve moved on. For a nominal charge - usually about $60, the RSC company will repair or replace many of the common mechanical systems and appliances found a residence should they wear out due to normal use.

These systems typically include HVAC systems, plumbing, electrical, oven, range, cook tops, built-in microwaves, trash compactor, disposal, water heaters and garage door opens. You also can purchase optional packages to cover permits, the hauling away of old equipment and limited code upgrades, kitchen refrigerators  built in wine coolers, washers and dryers, pool/spa equipment and septic system, septic plumbing and well pumps. Some policies even offer coverage for termites and pest control.

RCSs typically won’t cover the roof, the foundation or anything structural. They also won’t cover routine maintenance.

But for systems that just wear out, RSCs are a life saver! Such contracts have personally saved me thousands of dollars in repairs through the years and eased a lot of raging headaches when diswashers and garbage disposals wear out.

The catch phrase is “normal wear and tear.” Cosmetic defects typically aren’t covered. Nor is damaged caused by pets or misuse.

While most RSCs cost roughly the same, they’re not all created equal. Different policies have different limitations and exclusions. When your Realtor hands you an armload of literature, it helps to know upfront what you’re looking for and the questions to ask. Here’s a few to get you started:

  • Does the policy have an “obsolete parts clause”? An obsolete parts clause says that if the part to fix your system or appliance is no longer available, the RSC provider can just pay you for the cost of the part. The won’t pay to fix or replace your failed system or appliance.
  • Does the policy cover appliances or systems that break due to previously poor maintenance? Will it cover problems not detected during the home inspection process? During your home inspection, you can catch some problems and your Realtor can negotiate to have them fixed prior to closing on the home. However, a home inspection typically doesn't include the same level of inspection that say an HVAC tech would do. If an HVAC system breaks down because the coils were cleaned as scheduled, then some policies won’t cover it.
  • Does the policy cover problems that arise from incorrect installation? Recently we had a client who purchased a pre-existing home with an above ground spa. When the spa was installed, it required a new breaker box. The breaker box worked fine for the original owner, but failed within weeks of the new owner moving in. The RSC provider wouldn’t cover the repair because the new box was incorrectly installed in the first place.
  • Does the policy cover pre-existing conditions? If so how does are pre-existing conditions determined? Most policies won’t cover “known” pre-existing conditions. They also may place limitations on unknown pre-existing. For example, many companies would cover rust and corrosion claims made within the first 30 days that policy is in effect.
  • Does the RSC cover upgrade costs when a system has to be replaced? This is particularly important to ask if the home still has a SEER 10 system or one that uses Freon. New EPA mandates mean that SEER 10 systems and systems that use Freon are being phased out. When a SEER 10 system finally wears out, it will have to be replaced by the new standard. You’ll want to make sure that your RSC covers that hefty expense.
  • How much is the additional coverage for optional coverage for pool/spas, septic systems and for homes over 5,000 square feet in size? This is important to know because if you don’t ask for enough from the seller to cover the cost, you could end up paying for the additional coverage yourself.
  • How much is the second year of coverage? Again, this is important to know because you will be responsible for your own coverage after the first year.
  • Is the RSC provider licensed by the Texas Real Estate Commission (TREC)? Since 1979, all RCS providers in Texas have to be licensed by TREC.
  • Is the RSC provider a member of the National Home Service Contract Association? More than 90 percent of all RCSs written in Texas are done by association members/ Association members are required to adhere to standards of practice and offer the best recourse. In recent years, a lot of Internet-based RCS companies have popped up that are not licensed nor a member of the association. If they’re not, then you might not have any resource if they refuse to pay claims or disappear over night.

The best time to start shopping for a home warranty is when you start shopping for your new home. Ask your Realtor for information and recommendations early in the home shopping process. You’ll want give this important decision the attention it deserves. And not allow it to get lost among the hundreds of other decisions you’ll make in the purchase of your new home.

Monday, February 4, 2013

Texas real estate market finishes strong in 2012; consumer expectations rising for 2013

AUSTIN, Texas, Feb. 1, 2013 -- As a capstone to a year of accelerating momentum in Texas real estate, the fourth quarter of 2012 featured the strongest increases in sales volume and price for single-family homes in Texas seen last year, according to the Texas Association of Realtors.

Citing results published in the 2012-Q4 edition of the Texas Quarterly Housing Report issued today, the report shows increasing demand for Texas homes coupled with decreasing inventory, leading to rising prices and improving confidence among homeowners.

Shad Bogany , chairman of the Texas Association of Realtors, commented on the results, "Texas Realtors saw a marked increase in the pace of home sales as 2012 came to a close and homeowners are expressing a lot of enthusiasm about 2013."

As featured in the report, 56,488 single-family homes were sold in Texas in the fourth quarter of 2012, which is 19.82 percent more than the same quarter of the prior year. In addition, the median price was $159,200, which is 7.42 percent more than 2011-Q4. Those are the highest figures for sales volume and price seen in a fourth quarter inTexas since the association began issuing the Texas Quarterly Housing Report in 2009.

"This positive performance is evidence of a true rebound in Texas real estate that reaches broadly around the state," said Jim Gaines , Ph.D., economist with the Real Estate Center at Texas A&M University. "We're moving briskly down the road to recovery, thanks to positive economic activity in Texas and improvements in the attitudes homeowners have about the market. Looking ahead, I expect to see that confidence inspire more buyers and sellers to jump off the fence and into the market this year."

The fourth quarter of 2012 also marked the sixth quarter of decreasing inventory for the Texas real estate market, which is an indicator of the balance between supply and demand for homes. The market featured 4.6 months of inventory in 2012-Q4, which is 1.8 months less than the same quarter of the prior year. In comparison, the Real Estate Center cites 6.5 months of inventory as a market in which demand is balanced with supply.

Gaines explained, "Over the last year-and-a-half, we've seen steadily increasing demand for homes, but falling numbers of listings. That has caused the inventory of homes to shrink and prices to begin rising. Those price increases could give sellers confidence, spurring them to consider listing their homes in 2013."

Chairman Bogany continued, "These strong results show that we've been successful making Texas a great place to own a home. Now, we must help homeowners protect their investments by preparing for the growth of our state. That means securing adequate water supplies, investing in our roads and adding capacity for energy from diverse sources. Fortunately, Texas Realtors are on the case this Legislative session, advocating on behalf of private property owners all over the state."

The Texas Quarterly Housing Report is issued four times per year by the Texas Association of Realtors with multiple listing service data compiled and analyzed by the Real Estate Center at Texas A&M University. To view the report for 2012-Q4 in its entirety, visit www.TexasRealEstate.com.

About the Texas Quarterly Housing Report
Data for the Texas Quarterly Housing Report is analyzed by the Real Estate Center at Texas A&M University using statistics compiled from 48 multiple listing services in markets throughout Texas. The report includes data for single-family home sales over the course of one quarter and is scheduled for release by the Texas Association of Realtors on the following dates each year (or the next business day): Feb. 1, May 1, Aug. 1 and Nov. 1.

About the Texas Association of REALTORS®
With approximately 80,000 members, the Texas Association of REALTORS® is a professional membership organization that represents all aspects of real estate in Texas. We advocate on behalf of Texas REALTORS® and private-property owners to keep homeownership affordable, protect private-property rights, and promote public policies that benefit homeowners. Visit TexasRealEstate.com to learn more.


SOURCE Texas Association of Realtors
PR Newswire (http://s.tt/1zfGe)

Someone's in the Kitchen with Momma! Surprise! It's Dad!

Once upon a time, the kitchen was considered a mom's domain, but research shows that today's dads are taking a more active role in the kitchen, as well as with food shopping, menu planning and meal preparation. A national survey administered by Kraft Cheese reveals 96 percent of American dads are cooking for themselves or others every week.* 

This doesn't surprise me at all. When my nephews were growing up, my brother was the main family cook. Both of my sons are fabulous cooks as well. All of them are from scratch cooks, not prepackaged food, though their preference is to fire up the grill or the smoker or any appliance intended for outdoor cooking.
As dads become more comfortable in the kitchen – 94 percent are confident in their cooking skills – they're also looking to expand their recipe repertoire. Dads surveyed expressed an interest in mixing up their menus, with nearly half (46 percent) saying they'd like to expand the recipes in their regular rotation. Dads also cited cheese as a key ingredient to making most meals better, second to fresh herbs.

Key findings from dads who shared their opinions about what, why and how they are currently cooking.
  • Dads Dig Dinner: When it comes to meal preference, an overwhelming 63 percent of dads enjoy cooking dinner; 22 percent prefer cooking breakfast and 7 percent prefer lunch. 
  • Appetite for Chicken: The most common meals in regular rotation are chicken (84 percent), pasta (74 percent), sandwiches (67 percent) and burgers (64 percent). 
  • Daring Dads: More than half (58 percent) of dads surveyed say they are adventurous or spontaneous in the kitchen. 
  • Cheesy Goodness: According to the majority of dads, their favorite type of cheese to eat or cook with is Cheddar (24 percent) followed by Mozzarella (17 percent), American (10 percent) and Parmesan (10 percent). 

Tech-Savvy Daddy

In addition to understanding what dads are cooking, Kraft Cheese is picking dads' brains to learn more about how they are coming up with recipes. While it's no surprise modern dads are using technology – 83 percent use technology for cooking or meal planning – the survey revealed that more than half (51 percent) use a computer to print out recipes and nearly one in three (29 percent) dads look up recipes on smartphones or tablets.
 
American dads also hit up their social networks for ideas on what to cook. Nearly a quarter of dads (22 percent) ask for ideas from friends or people on their social networks and 20 percent use social media tools, such as Facebook and Instagram. 

* Survey of 1,046 nationally representative American fathers, ages 18 and older, conducted by Kelton on behalf of Kraft Cheese between December 18 and December 27, 2012. The chances are 95 in 100 that a survey result does not vary, plus or minus, by more than 3 percentage points from the result that would be obtained if interviews had been conducted with all persons in the universe represented by the sample. Options were rotated to avoid favorability.

SOURCE Kraft Foods

PR Newswire (http://s.tt/1z2gT)


Sunday, February 3, 2013

Craft Beer Sales on the Rise

Craft and craft-style beers are defying recessionary trends with an impressive upward trajectory. Indeed, latest research by Mintel on the craft beer market in the US shows that sales of craft beer nearly doubled between 2007 and 2012—increasing from $5.7 billion in 2007 to $12 billionin 2012.

Moreover, the trend toward craft beer options is set to enjoy robust growth through 2017, with Mintel forecasting the segment to grow to $18 billion by 2017 — a result that will see the segment tripling in the decade between 2007 and 2017.

Jennifer Zegler , beverage analyst at Mintel, says: "The growth rates seen by craft beer are impressive, especially during a period when domestic and imported beers have shown a flat to declining performance. Unlike its domestic and imported beer counterparts, craft beer has been able to defy overall beer market trends and continue expansion during the economic downturn and subsequent slow recovery. While the craft and craft-style beer category remains a small segment of the $78 billion U.S. beer industry, the category has been able to stabilize the overall beer industry, which has experienced volume declines in the domestic and imported beer categories since 2008."

The rise of craft beer in the US has been supported by increasing consumer demand. Nearly a quarter (24%) of consumers who drink beer indicate that in 2012 they drank more craft beer sold at stores compared to 2011. Meanwhile, more than one in five (22%) report consuming more craft beer in bars or restaurants.

When looking at age, Mintel research shows that craft beer's sweet spot is with 25-34 year old consumers. While overall, some 36% of US consumers drink craft beer, half (50%) of older Millennials (25-34 year olds) do so. And craft beer also wins on taste. Some 43% of both Millennials and Generation X say that craft beer tastes better than domestic beer, compared to 32% of Baby Boomers.

Although successful, craft beer is not free from challenges. Only 17% of Millennials and 18% of Generation X say that craft beer is a better value. Instead, a majority (56%) of consumers of all ages feel that domestic beer is better value compared to craft beer. Furthermore, Mintel research found that nearly half (45%) of consumers would try more craft beers if they knew more about them.

"Despite the variety of beer releases created by craft breweries, craft beers are not yet everyday beer choices for most drinkers due to a lack of understanding about their taste profiles. To continue growing, craft beer must be its own best advocate and expand appeal beyond Millennials who are most likely to consume craft beer. An additional barrier is lack of knowledge. Craft brewers need to focus on education through tastings and classes that inform consumers about the differentiation in flavor between craft beer and other alcoholic drinks," Jennifer Zegler explains.

In addition, Mintel research found that 50% of overall craft beer drinkers express interest in locally made beer, and 25% are interested in purchasing craft beer where it was brewed. Another 39% say that they are influenced to purchase a craft beer if it has a personality to which they can relate.

"Buying local is not limited to supporting one's homebase; it also provides consumers with the ability to support towns that they do not currently call home. To bring that local feel to consumers regardless of location, craft breweries should consider partnering to create multibrewery variety packs that would offer consumers a taste of one city, state, or region. These taste-of-an-area packages would allow consumers to experience smaller breweries from their own or other geographies," Jennifer Zegler concludes.

PR Newswire (http://s.tt/1yQoG)

Top Five Food Trends for 2013... Are They on Your Menu?

The top five food trends for 2013 have been picked by a panel of trendspotters at the 38th Winter Fancy Food Show, which ends today in San Francisco. The show is the largest marketplace for specialty foods and beverages on the West Coast, with 80,000 products on display including cheeses, snacks, olive oils, vinegars, chocolate, and natural and organic products from the U.S. and 35 countries and regions.
The trends are:

Botanical Beverages
  • Numi Organics: Broccoli Cilantro Tea
  • Wild Poppy Juice Co.: Blood Orange Chili Juice
  • The Republic of Tea: Moringa SuperHerb Tea
Oil Nouveau
  • Arette Foods: Organic Tea Seed Oil with Sundried Tomatoes & Chili Pepper
  • Culinary Imports: Stoger Cherry Seed, Chile Seed and Tomato Seed Oils
  • La Tourangelle Artisan Oils: Organic Coconut Oil
Blue Cheese Redux
  • Bissinger's Handcrafted Chocolatier: Point Reyes Blue Cheese Wine Grapes
  • Rogue Creamery: Blue Heaven Blue Cheese Powder
  • Mt. Sterling Co-op Creamery: Smoked Sterling Bleu Goat Cheese
So Many Seeds
  • Enjoy Life Natural Brands: Crunchy Flax Chia Cereal
  • K.L. Keller Imports: Dukkah
  • Lundberg Family Farms: Hemp-a-Licious Organic Rice Cakes
Top Banana
  • Vosges Haut-Chocolat: Wild Ophelia Peanut Butter & Banana Milk Chocolate Bar,
  • PB Crave: CoCo Bananas Peanut Butter
  • GoodPop: Frozen Banana Cinnamon Pops

Other trends identified are fruit-infused vinegars, chips with a healthy glow such as fuji apple chips, peppery sweets such as cayenne shortbread, agave, and single-serve sizes.

The trendspotters are: Maureen Clancy , Matters of Taste; Narsai David , CBS San Francisco; Nancy Wall Hopkins, Better Homes and Gardens; Sara Moulton , "Sara's Weeknight Meals," Good Morning America; Kara Nielsen , CCD Innovation; Denise Purcell , Specialty Food Media; Stephanie Spencer ,Sunset Magazine; Stephanie Stiavetti , NPR, Susie Timm , Girl Meets Fork; Joanne Weir , " Joanne Weir 's Cooking Confidence," PBS.

Saturday, February 2, 2013

The National Foreclosure Inventory Has Fallen 19.5 Percent From One Year Ago

CoreLogic Reports 767,000 Completed Foreclosures in 2012


RVINE, Calif., February 1, 2013 — CoreLogic® (NYSE: CLGX), a leading residential property information, analytics and services provider, today released its National Foreclosure Report, which provides data on completed U.S. foreclosures and the overall foreclosure inventory. According to CoreLogic, there were 56,000 completed foreclosures in the U.S. in December 2012, down from 71,000 in December 2011, a year-over-year decrease of 21 percent. On a month-over-month basis, completed foreclosures fell from 58,000* in November 2012 to the current 56,000, a decrease of 3 percent. As a basis of comparison, prior to the decline in the housing market in 2007, completed foreclosures averaged 21,000 per month between 2000 and 2006. Completed foreclosures are an indication of the total number of homes actually lost to foreclosure. Since the financial crisis began in September 2008, there have been approximately 4.1 million completed foreclosures across the country.

Approximately 1.2 million homes were in the national foreclosure inventory as of December 2012 compared to 1.5 million in December 2011, a 19.5 percent year-over-year decrease. Month over month, the national foreclosure inventory was down 4.2 percent from November 2012 to December 2012. The foreclosure inventory is the share of all mortgaged homes in any stage of the foreclosure process. The national foreclosure inventory as of December 2012 represented 3 percent of all homes with a mortgage.

“The most encouraging foreclosure trend reported here is that the inventory of foreclosed properties is almost 20 percent smaller than a year ago,” said Mark Fleming, chief economist for CoreLogic. “This big improvement indicates we are working toward resolving the backlog of the most distressed assets in the shadow inventory.”

“The rate of foreclosures continues to trend down, albeit at a slower rate as we exit 2012,” said Anand Nallathambi, president and CEO of CoreLogic. “This trend should continue into 2013 and is another positive signal that the gradual healing process in the housing market is gaining traction.”

Highlights as of December 2012:
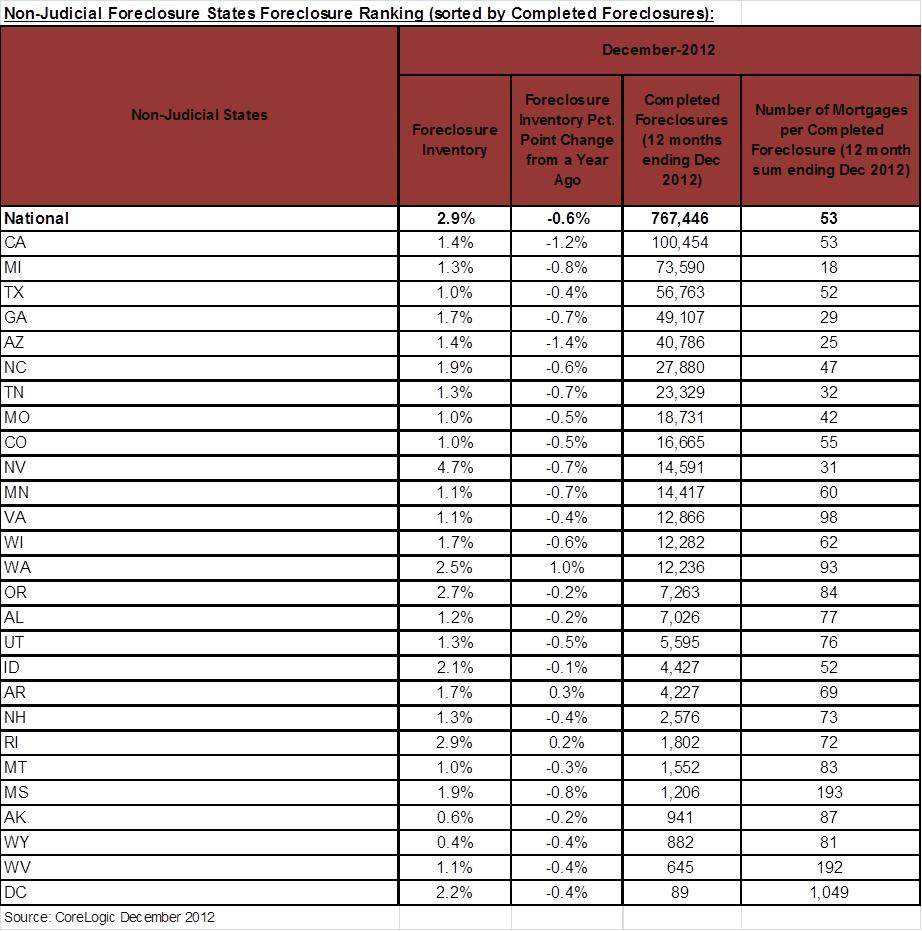
The five states with the highest number of completed foreclosures for the 12 months ending in December 2012 were: California (100,000), Florida (98,000), Michigan (74,000), Texas (57,000) and Georgia (49,000).These five states account for almost half of all completed foreclosures nationally.
The five states with the lowest number of completed foreclosures for the 12 months ending in December 2012 were: District of Columbia (89), Hawaii (421), North Dakota (521), Maine (537) and West Virginia (645).
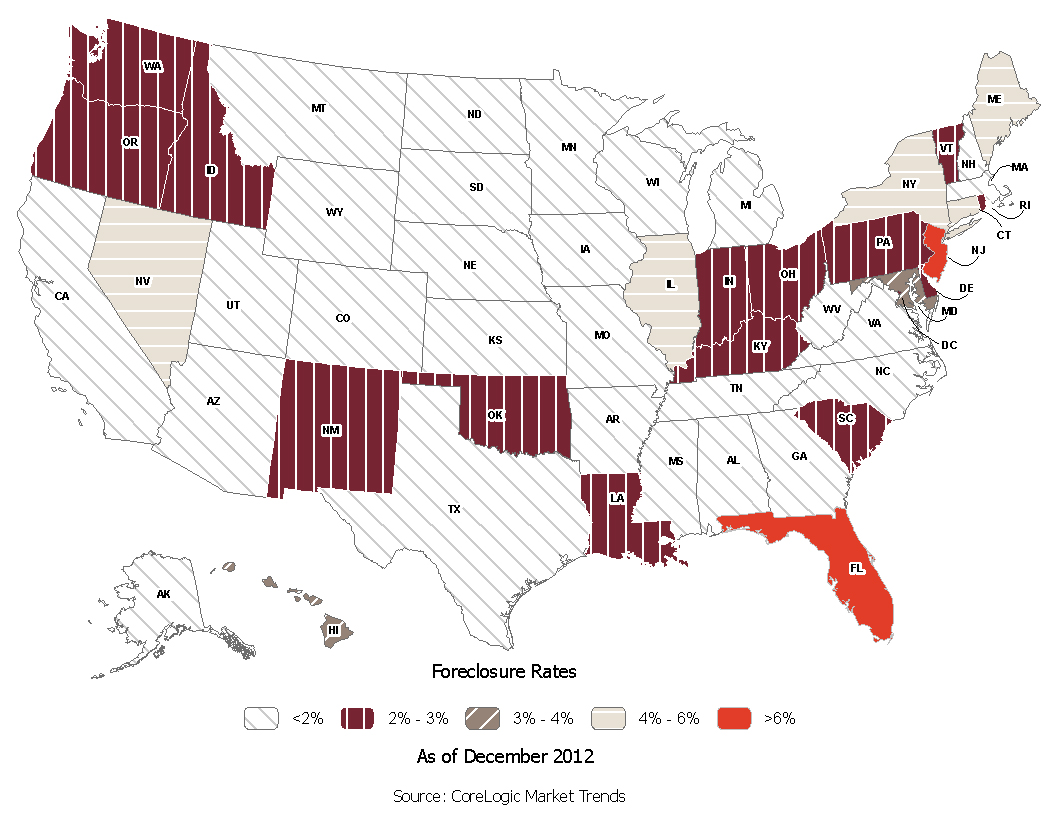
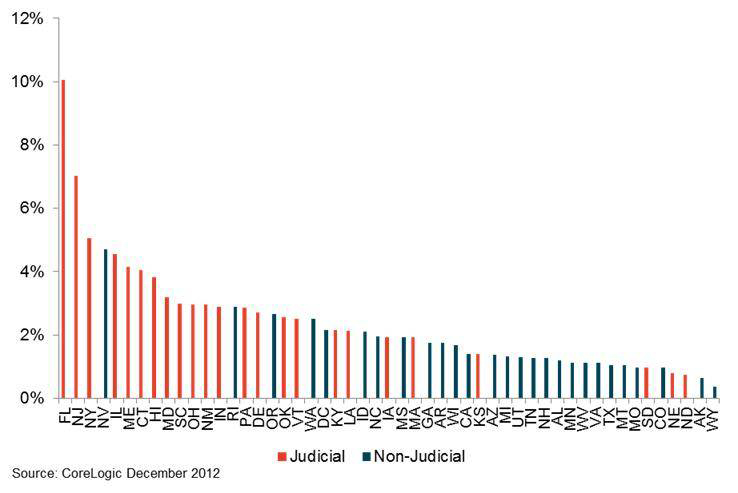
The five states with the highest foreclosure inventory as a percentage of all mortgaged homes were: Florida (10.1 percent), New Jersey (7.0 percent), New York (5.1 percent), Nevada (4.7 percent) and Illinois (4.5 percent).
The five states with the lowest foreclosure inventory as a percentage of all mortgaged homes were: Wyoming (0.4 percent), Alaska (0.6 percent), North Dakota (0.7 percent), Nebraska (0.8 percent) and Colorado (1.0 percent).

*November data was revised. Revisions are standard, and to ensure accuracy, CoreLogic incorporates newly released data to provide updated results.

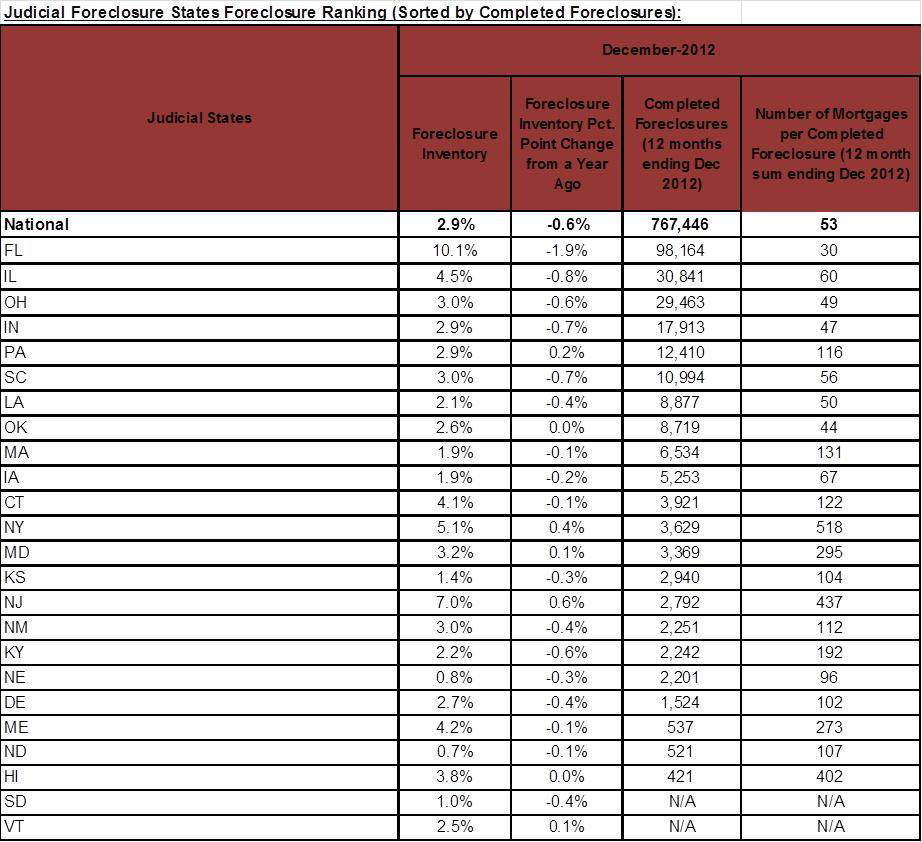
Table 1 – Judicial Foreclosure States Foreclosure Ranking (Sorted by Completed Foreclosures)

Table 2 – Non-Judicial Foreclosure States Foreclosure Ranking (Sorted by Completed Foreclosures)

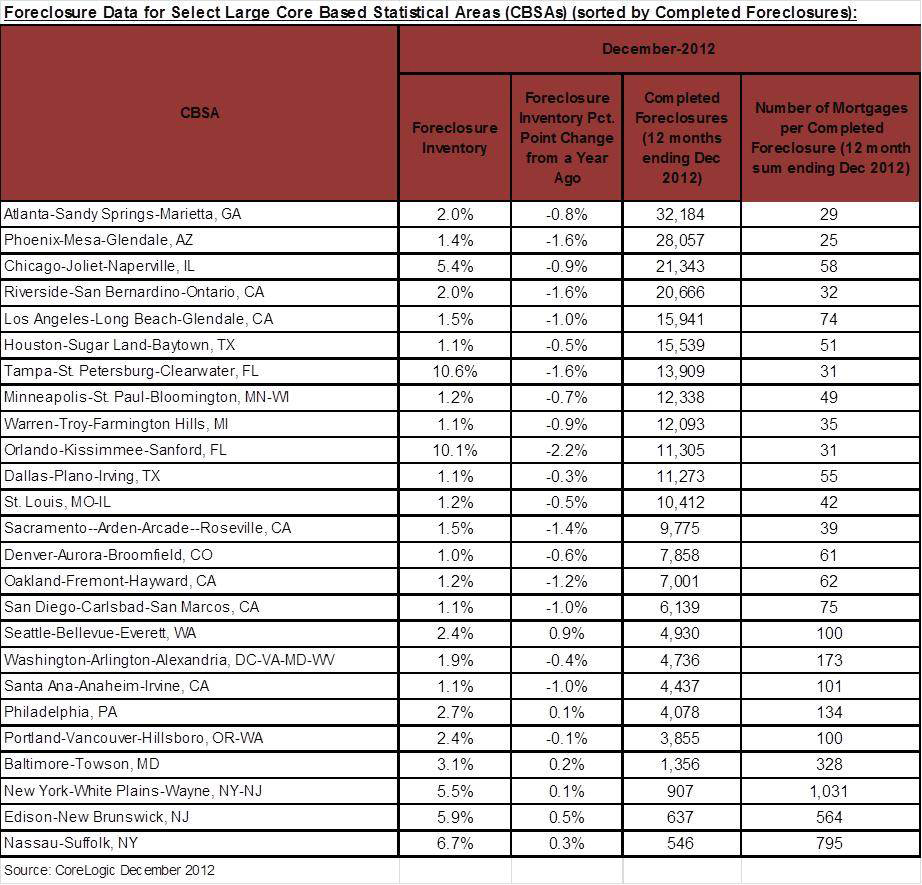
Table 3 – Foreclosure Data for Select Large Core Based Statistical Areas (CBSAs) (Sorted by Completed Foreclosures)

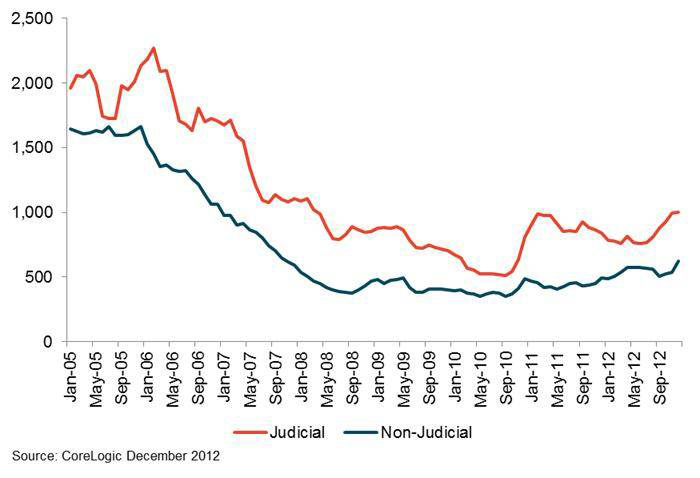
Figure 1 – Number of Mortgaged Homes per Completed Foreclosure
Judicial Foreclosure States vs. Non-Judicial Foreclosure States (3-month moving average)


Figure 2 – Foreclosure Inventory as of December 2012
Judicial Foreclosure States vs. Non-Judicial Foreclosure States


Figure 3 – Foreclosure Inventory by State Map

Baby Clydesdale Featured in Super Bowl XLVII Commercial

Super Bowl commercials are the best part of the Sunday events, and Budweiser always delivers. Check what's planned for this year! 
Budweiser has launched its first-ever Twitter account – www.twitter.com/budweiser. The account went live earlier this week.
The iconic brand marked the occasion with another "first" involving the Budweiser Clydesdales – tweeting the first photo of a member of the elite "Budweiser Clydesdales Class of 2013," a beautiful 150-pound baby born the morning of Jan. 16. It was the brand's first-ever Tweet.

Using #clydesdales, Budweiser also is asking Twitter followers of @Budweiser and Facebook friends to help name the young equine star, who will be seen by an estimated 110+ million viewers Sunday during Super Bowl XLVII.

"This newest member of the Budweiser Clydesdale family was 7 days old on the day this part of the Super Bowl commercial was filmed," said Jeff Knapper , general manager of Clydesdale operations. "A star was truly born on Jan. 16."

More than 30 baby Clydesdales are expected to be born this year at the 300-acre Warm Springs Ranch, the state-of-the-art breeding facility for the Budweiser Clydesdales in Boonville, Mo.

On Super Bowl Sunday on Feb. 3, the Budweiser Clydesdales will appear in a new 60-second spot, "Brotherhood," which chronicles the bond a Clydesdale foal shares with his trainer. Partially shot at Warm Springs Ranch, "Brotherhood" will take the Clydesdales advertising into new territory by providing a new level of access to their early years.

This is the Clydesdale's 23rd Super Bowl spot since first appearing in a big game spot in 1986.
In addition to the baby foal born this month that will appear in the spot, other young Clydesdales, including an 8-month-old and a 2-year-old, will be featured, in addition to a full hitch of eight adult horses.

2013 A MILESTONE YEAR

The Clydesdales celebrate a major milestone in 2013 – the 80th anniversary of their association with Anheuser-Busch. The Budweiser Clydesdales have been an integral part of Anheuser-Busch's heritage since April 7, 1933, and their strength and majesty symbolize Budweiser quality as well as integrity, achievement, success, perfection and team spirit. They were formally introduced to celebrate the repeal of Prohibition for beer.

"The symbol has become synonymous with Budweiser — the quality that goes into the beer, as well as the time, energy and passion we put into taking care of the horses," Knapper said.

How is the baby Clydesdale featured in the commercial doing? Both mother, 7-year-old Darla, and baby are doing well, reports John Soto , supervisor of the breeding operations at Warm Springs Ranch in mid-Missouri.

"We have had two foals born so far this year, and they're both doing very well," Soto said.

"We take great pride in each and every one of our horses, and Warm Springs Ranch is a great home," Knapper said. "The Budweiser Clydesdales are the envy of the equine world. We treat them like royalty, and they are among the best-cared-for animals in the world."

Anheuser-Busch has about 200 Clydesdales in its herd, with about half of them at Warm Springs Ranch in Cooper County.

About Warm Springs RanchWarm Springs Ranch features a 25,000-square-foot breeding barn with a veterinary lab and 10 pastures, each with a customized, walk-in shelter and free-flowing water dispensers. The farm sits on 300-plus acres of land, allowing the Clydesdales plenty of room to exercise and roam.

Dedicated staff is on site around the clock to ensure the baby Clydesdales are welcomed into the world in comfort and safety. Those Clydesdales born with the proper markings for a Budweiser Clydesdale – a bay coat, a blaze of white on the face, four white stocking feet, and a black mane and tail – have a future spot on one of the traveling hitches.

PR Newswire (http://s.tt/1z2h8)