Monday, April 18, 2016

Realtor.com® Identifies America's Boom Towns

New construction, job growth and household formation combine to propel these neighborhoods to America's fastest growing

Realtor.com®, a leading online real estate destination operated by News Corp [NASDAQ: NWS, NWSA]; [ASX: NWS, NWSLV] subsidiary Move, Inc., today released its list of America's Top 'Boom Towns'. Led by Gilbert, Ariz. (85297); Los Angeles (90012), and Dallas (75201), these neighborhoods are striking it rich when it comes to new home construction, job creation and an increasing number of households – the gold mine for housing market growth.

"The strength of the residential real estate market is closely correlated to growth in jobs and households," said Jonathan Smoke, chief economist for realtor.com®. "The good news for these markets is that these growth factors have already started to translate into new construction. At the same time, it may be a year or so before some markets on our list start to see an increase in inventory. If anything, this is a road map for where builders should be thinking about where to break ground next."


America's Top Boom Towns are demonstrating some of the strongest growth in jobs, household formation, and housing starts across the country. Every market on the list has experienced between one and five times the average job growth of the top 100 counties in the country. Household growth in each of these areas is between one and seven times the average growth of the top 100 areas. New home starts are between one and six times the average growth in the top 100 counties. Most importantly, each individual ZIP code is projected to see a growth in households of between nine and 19 percent over the next five years.

America's Top Boom Towns

Ranking
ZIP Code
ZIP Projected 5 YR HH Growth
County HH Growth 2016 vs. Top 100
County Starts Growth 2016 vs. Top 100
County Job Growth 2016 vs. Top 100
1.
15.9%
7.6X faster
5.7X more
5.8X more
2.
8.8%
6.1X faster
5.0X more
7.2X more
3.
14.9%
3.0X faster
3.8X more
4.5X more
4.
14.9%
3.0X faster
3.0X more
4.8X more
5.
19.4%
3.3X faster
3.3X more
2.5X more
6.
11.9%
3.1X faster
3.1X more
2.3X more
7.
12.1%
1.7X faster
2.4X more
1.3X more
8.
9.2%
1.9X faster
1.9X more
2.0X more
9.
18.9%
2.5X faster
1.4X more
4.2X more
10.
15.7%
1.6X faster
2.3X more
1.4X more
Methodology: Realtor.com® combined projected measures of job creation, household formation and new construction for 2016 to identify the top growth counties. Based on this information, the top ZIP code for each county was identified based on its five year projected household growth.

Saturday, April 16, 2016

Understanding the millennial home


For years, consumer buying power and purchasing trends have focused around baby boomers. However, within the past several years, the spotlight has shifted to the 80-plus million Americans between the ages of 25 and 34 known as millennials. Now the largest demographic group in history, this generation is undoubtedly the most studied. Significant research findings, speculations and predictions about shopping habits and motivators are driving the world to cater to this influential group.

Home ownership is one example. Many speculate millennials aren't interested in, or in a position to buy a home because they're strapped with student loans and a tightened job market. While much of that is true, research paints a different overall picture. In fact, in many U.S. cities, millennials make up half or more of home purchasers (many of them first-time home buyers), according to a recent study by Realtor.com and reported by Bloomberg.So what are millennials looking for in their home? According to the recent Responsive Home initiative conducted by Builder Magazine, TRI Pointe Group (Pardee Homes) and partners such as Danze, Inc., several priorities rose to the top of their "must have" list when purchasing or building a home:
* Ability to maximize all spaces within the home (efficient, creative storage)
* Urban conveniences in suburban settings (able to walk to parks and schools)
* Plentiful outdoor space, including an outdoor kitchen when possible
* Customizable floor plans (i.e., ability to have a nanny or mother-in-law suite with kitchenette and more)
* Elements with high design that offer functionality and value
"There's no doubt this generation is very design savvy and has outstanding taste," says Sharon Overby, vice president of Danze, Inc. "We were excited to be part of the Responsive Home project. Our kitchen and bath faucets, shower systems, bath accessories and others play well with the design-functionality-value ratio."
Among the unique design aspects was the use of satin black as a finish throughout many of the bathrooms. Showerheads, faucets and accessories were often mounted on white subway tile (grouted in black) for a fun, impactful style.
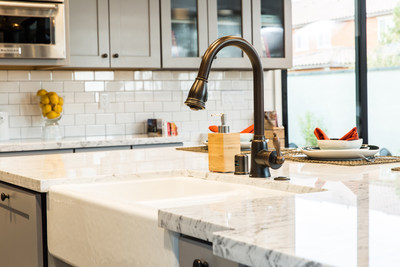
In one of the kitchens, Responsive Home Creative Director Bobby Berk paired a white farmhouse sink with a Danze pull-down faucet in a tumbled bronze finish. The juxtaposition of mixing and matching elements such as these are at the heart of millennial style.
Outdoor living has proven to be a hot button for many buyers, including these 25-34-year-olds. The Responsive Home project featured unique use of outdoor space that showcased sunken sitting areas surrounded by beautiful gardens and water features, various applications of large-screen TVs and, of course, fully functional beautiful outdoor kitchens.
"The Danze line is a great match for this set of home buyers, whether they're building new or fixing up an existing home," adds Overby. "We've proven that eye-catching design and value-focused pricing can co-exist in kitchen and bath products, which are often a big aspect to the personality and style of a home."

Friday, April 15, 2016

Economic Growth Outlook Remains Little Changed Despite First-Quarter Stall

Economic growth stalled during the first quarter of 2016 but the full-year outlook remains little changed at 1.9 percent, according to Fannie Mae's (OTC Bulletin Board: FNMA) Economic & Strategic Research (ESR) Group's April 2016 Economic and Housing Outlook. Consumer and business spending and net exports came in below expectations, and trade, inventory, and business investment likely weighed heavily on GDP in the first quarter. However, the ESR Group does not view weakness in the first quarter as the start of deteriorating economic activity and expects slightly better growth in the second quarter buoyed by a pick-up in consumer spending that should continue over the rest of the year.

"We expect a healthy labor market, the solid hiring trend seen during the last few months, and stronger household incomes to boost consumer spending over the rest of the year despite weak economic activity in the first quarter," said Fannie Mae Chief Economist Doug Duncan. "The fourth consecutive increase in the labor force participation rate amid solid job growth has slowed the decline in the unemployment rate, and, combined with anemic productivity growth, may help explain the failure of wages to accelerate more rapidly. With the uptrend in the labor force participation rate and subdued wage pressure, the Fed appears to feel less urgency for a second fed funds rate hike, particularly given that risks to global economic and financial developments are tilted to the downside. We now expect only one rate hike in 2016 in the second half of the year."


"Our forecasts for housing activity, mortgage rates, and mortgage originations are little changed in the April forecast. We expect total mortgage originations to decline about 9.0 percent in 2016 to $1.56 trillion, with a refinance share of 40 percent," said Duncan. "Sustained improvement in the labor market and personal incomes among young adults should draw more potential homebuyers into the housing market, but many will continue to face affordability challenges. Home price growth has been rising at a faster clip than incomes, and the increasing supply of single-family housing is skewed toward larger and less affordable homes. These factors continue to weigh on housing affordability, particularly for first-time homebuyers."

Visit the Economic & Strategic Research site at www.fanniemae.com to read the full April 2016 Economic Outlook, including the Economic Developments Commentary, Economic Forecast, Housing Forecast, and Multifamily Market Commentary. To receive e-mail updates with other housing market research from Fannie Mae's Economic & Strategic Research Group, please click here.

Thursday, April 14, 2016

March Dallas - Fort Worth Housing Market Stats

dfw_stats_overview  3 16.jpg

Realtors® Give Homebuyers Leg Up in Competitive Spring Market

With demand exceeding supply in markets across the U.S., homebuyers may be facing an uphill battle to find the perfect home this spring. Total housing inventory at the end of February was 1.88 million existing homes available for sale, 1.1 percent lower than last year and at a 4.4 month supply at the current sales pace, which is below the roughly six month supply level needed for a balanced market between buyers and sellers.
In competitive markets like this, it is important that homebuyers work with a Realtor®.  Realtors® who have the National Association of Realtors®' Accredited Buyer's Representative® designation are specialized practitioners focused on working directly with buyer-clients and helping them through the challenges of finding the right home in a seller's market.
"When there is more demand than inventory homes sell quickly, prices rise and bidding wars can start," said NAR President Tom Salomone, broker-owner of Real Estate II Inc. in Coral Springs, Florida. "A Realtor® with an ABR® designation is a home buyer's upper hand; they understand local markets and can negotiate on behalf of their buyer-clients."
Adds Salomone, "Buying a home is often one of the biggest decisions of a person's life, and having a Realtor® in their corner is the ultimate advantage. They are there to guide consumers through the complexities of this life-changing transaction."  
NAR's 2015 Profile of Home Buyers and Sellers asked recent homebuyers what they look for when deciding on a real estate agent; 53 percent said they were looking for someone who could help them find the right home to purchase, and 12 percent said they wanted someone who can help them negotiate the terms of sale. The report also found that homebuyers look at a median of 10 houses before deciding on one to purchase, and the typical search lasts for 10 weeks.
"Having a real estate expert with specific knowledge of the local market and purchase process can mean the difference between a homebuyer getting that 10th house and having to search for another," said Salomone.
In 2016, the ABR® designation celebrates its 20th anniversary, with over 28,000 ABR® designees. Realtors® with the designation are experienced real estate agents who have completed advanced training in representing the specific needs of buyers during a real estate transaction and have unique, up-to-date insights on the best way to approach their local market.
The designation is awarded by the Real Estate Buyer's Agent Council, a wholly-owned subsidiary of NAR and the world's largest association of real estate professionals focusing specifically on representing the real estate buyer.

Tuesday, April 12, 2016

Homes with 'Subway Tiles,' 'Barn Doors' or 'Farmhouse Sinks' Can Sell for Up to 13 Percent More and 60 Days Faster

For-sale listings touting craftsman or farmhouse-style design features sell faster and for more money than expected, according to Zillow Digs analysis

Why do some homes sell for a premium? In addition to timing, a home's listing description can have a significant impact on its final sale price. Listings mentioning keywords like "barn door," "shaker cabinets" or "subway tiles," sell faster and for up to 13 percent more than expected, according to a Zillow Digs® analysisi.

Zillow Digs analyzed listing descriptions from over 2 million homes nationwide sold between January 2014 and March 2016 to see how certain keywords referring to home features, amenities and design styles impacted their sale price.

Of the 60 keywords analyzed, listings mentioning "barn doors," a rustic sliding door often used on bedroom closets and kitchen pantries, saw the highest sale premium (13 percent above expected values). Other common craftsman-style keywords like "farmhouse sink" were also found in top-performing listings. Furthermore, homes described as "craftsman" performed better than any other design style analyzed. While people may think the rustic mason jar-vibe is out, it is still very popular with today's buyers.

"When it comes to real estate listing descriptions – words matter," says Dr. Svenja Gudell, Zillow chief economist. "Your listing description is an opportunity to highlight specific details and finishes that might not be visible in photos. Craftsman-style homes and amenities resonate incredibly well with today's buyers – so if you've got them, flaunt them! Meanwhile, not only are subway tiles and shaker cabinets popular with home buyers, they may also signal that the home has other desirable features like an open floor plan or a well-appointed kitchen."

Understanding what's popular among buyers can also help homeowners who are considering remodeling. For example, listings descriptions that included "new carpets" had no effect on the home's sale price, but listings mentioning "hardwood floors" sold for two percent more than expected. While everyone has different preferences, when it's time to sell, a listing mentioning hardwood floors may be more likely to catch a future buyer's eye.

This report stems from an analysis in the New York Times best-seller, "Zillow Talk: Rewriting the Rules of Real Estate," which looks at how certain listing descriptors like "unique" or "captivating" can impact final sale prices. More information can be found at http://www.zillow.com/zillowtalk/.
Home Feature Keyword
Effect (percent
homes sells for
above expected
values)
Effect (how
many days
faster than
expected the
home sells)
Most Common
Metro
Barn Door
13.4%
57
Phoenix, AZ
Shaker Cabinet
9.6%
45
Los Angeles, CA
Farmhouse Sink
7.9%
58
Los Angeles, CA
Subway Tile
6.9%
63
Philadelphia, PA
Quartz
6.0%
50
Los Angeles, CA
Craftsman
5.4%
14
Seattle, WA
Exposed
Brick
4.9%
36
New York, NY
Pendant Light
4.6%
48
Phoenix, AZ
Frameless Shower
4.6%
38
Dallas, TX
Heated Floors
4.3%
28
Seattle, WA
Stainless Steel
4.2%
42
Chicago, IL
Granite
4.1%
38
Dallas, TX
Backsplash
4.1%
46
Philadelphia, PA
Tankless Water Heater
4.0%
43
Los Angeles, CA
Outdoor Kitchen
3.7%
19
Tampa, FL

Friday, April 8, 2016

Coldwell Banker Previews International Luxury Market Report Reveals Florida & Hot Tech Cities With Emerging High-End Markets Experienced Major Sales Growth In 2015

Report on Top 20 Luxury Real Estate Markets Shows Florida, Atlanta, Seattle & Austin Surge while Bay Area Tech Communities Leveled Off Due to Lack of Inventory

ales of $1 million-plus homes in 2015 surged 32 percent year-over-year in Austin, which is experiencing a boom in tech and entertainment as the home of the  Festival; 31 percent in Fort Lauderdale, which benefits directly from its proximity to the perennial luxury hub of Miami; and 30 percent in Seattle, which has achieved gold status as a tech mecca. These increases — some of the largest of any cities in the nation — earn them standout status as entry-level luxury real estate markets as revealed by the new Luxury Market Report released today by the Coldwell Banker Previews International® marketing program.
$5 Million+ Category  In the $5 million-plus category of home sales, California cities dominated the Top 10 list, earning five of the top spots, withSouthern California leading with six of the top 10 spots and four of the top five. The exclusive Southern California beachside destination of La Jolla was a clear frontrunner, doubling its sales in this range from 2014 to 2015. Meanwhile, Florida claimed five of the top spots.
$10 Million+ Category  Newport Coast, one of the newest California coastal communities to join the $10 million-plus top 20, experienced a massive 175 percent increase in luxury sales more than $10 million. Florida added two newcomers to the list, Wellington and Lake Worth. Outside of New York, Beverly Hills continues to hold the top position for sales more than$10 million. Combining all cities that made the list in Los Angeles County, there were 96 unit sales more than $10 million, an increase of 17 percent in 2015. A stand out for luxury home sellers was the star-studded Pacific Palisades, Calif., commanding a 95 percent ratio of list to sales price.
Overall Luxury Market Summary for 2015 Across all price categories, Florida elevated its coveted position as a top destination for the real estate elite, recording double-digit growth in Miami, Naples and Palm Beach and adding newcomers Lake Worth and Wellington, which placed in the Top 20 list for $10 million sales for the first time. 
Tech epicenters in the Bay area posted only modest gains in the number of closed sales as demand outstripped supply in 2015. San Francisco closed 57 percent more units than the previous year at $10 million-plus (11 units in 2015 vs. seven units in 2014) but declined 13 percent in sales of units priced $1 to $5 million, posting a mere 3 percent gain in sales of $5 to $10 million. "Some cities in the Bay area have a 42-day supply of inventory that has left many affluent buyers empty-handed and pushed down potential sales gains," says Mike James, president of Coldwell Banker Residential Brokerage, San Francisco Peninsula and North Bay areas.
The ski markets presented a mixed picture: Aspen made the top six list of luxury home sales both in the $5 million-plus and $10 million-plus categories. Vail recorded a strong showing, but another perennially popular ski destination, Park City, ranked fifth in the nation in both active listings more than $1 million and more than $5 million, yet it did not make the top 20 in either sales category. 
Overall, more than 50 percent of the Top 20 cities for luxury home sales across all price categories experienced an increase in activity and more than 40 percent met or exceeded the 90 percent mark of list to sales price. All Top 20 cities with the largest increases in sales of homes more than $1 Million revealed list-to-sales-price ratios of 90 percent or higher, demonstrating robust demand and that sellers are commanding close to asking price in key luxury markets nationwide.
The full Coldwell Banker Previews International list of the Top 20 Best Performing U.S. Cities in Luxury Real Estate by price points of $1 million-plus, $5 million-plus and $10 million-plus, and the high-net-worth consumer survey results can be viewed here: http://www.previewsinsideout.com/2016/04/luxury-market-report-spring-2016
Luxury Market Report MethodologyAll market data has been gathered from the Multiple Listing Service (MLS) databases known or believed to be the primary real estate broker cooperative resources for each market referenced in the report. All closed sales activity reported is for the annual period January 1, 2015 through December 31, 2015. Closed sales reported to the MLSs significantly later than this analysis period will not be included. All active status listing records were downloaded and processed to the same standards, and on various dates, during the months of January and February, 2016. Active status listings added to the MLSs significantly later than download dates will not be included. Property-specific listing and sales records were standardized to USPS address city and ZIP Code, inaccurate list and sale prices were corrected when necessary, and all duplicate records were manually excluded. Average list price and average sales price calculated based on original list price where available. As a result, statistics available via the source data providers may not correlate to this analysis. While all results are believed to be highly accurate, MLS systems do not report all real estate activity in their primary marketplace, and there may have been property transfers not included in this analysis. Copyright © 2016, Real Data Strategies, Inc. All rights reserved. Licensed for the exclusive use of Coldwell Banker Real Estate LLC.

Tuesday, April 5, 2016

Equifax: First Mortgage Origination Balances in 2015 Increased 42.9 Percent over Previous Year

Underwriting practices remain consistent, with median credit score remaining relatively unchanged for last three years

According to data from the March 2016 Equifax National Consumer Credit Trends Report, the total balance of new first mortgages originated in 2015 was $1.82 trillion, a year-over-year increase of 42.9 percent, while the total number of new first mortgages originated in that same time was 7.71 million, an increase of 31.6 percent.

The data also shows that first mortgage lending to borrowers with subprime credit (consumers with an Equifax Risk Score™ of 620 or below) also showed strong growth. Year-over-year changes in 2015 include:
  • Balances: $59.7 billion, an increase of 41.3 percent; and
  • Number of Loans: more than 366,900, an increase of 25.2 percent.
"We saw a nice jump in mortgage lending in 2015 that was driven by both rising home-purchase activity and solid refinancing volumes," said Amy Crews Cutts, Senior Vice President and Chief Economist at Equifax. "While low interest rates are helping, continued gains in employment and consumer confidence are key. What we are not seeing is any meaningful loosening of underwriting, at least with respect to credit scores. The median credit score on new first mortgages in the fourth quarter of 2015 was 750 and 90 percent of first mortgage borrowers had a score in excess of 646 – these values are essentially unchanged for the past three years."

Additional data from the March 2016 Equifax National Consumer Credit Trends Report includes:

Home Equity Installment Loans
  • The total number of new home equity installment loans originated in 2015 more than 791,900, an increase of 26.7 percent from the previous year. The total balance of new loans in that same time was $26.5 billion, an increase of 20.8 percent;
  • The total number of new loans originated 2015 was the highest level in more than seven years, while in that same time, 2014-2015 showed the third-highest percentage increase, for a calendar year since 2008.
  • There were more than 83,000 new loans originated for borrowers with subprime credit in 2015, a year-over-year increase of 31.2 percent. In that same time, the total balance of new loans was $1.73 billion, an increase of 6.5 percent.
  • In 2015, 10.5 percent of all loans were issued to subprime-credit borrowers, a slight increase from the previous year's share (10.1 percent).

Home Equity Lines of Credit (HELOC)
  • The total credit limits of new loans originated in 2015 was $146.1 billion, a 19.7 percent increase from the previous year. In 2015, the total number of new loans originated was just under 1.39 million, an increase of 11.7 percent over 2014;
  • There were 20,100 loans originated for borrowers with subprime-credit in 2015, an increase of 15.2 percent and the highest total since 2008 (35,660 loans);
  • The total credit limits on new subprime HELOCs in 2015 was $745.2 million, an 8.5 percent increase and the highest total since 2008 when they totalled more than $1.78 billion.